Vitamin D Deficiency in Europe- need at least 1000 IU to get to even 20 ng – Cashman
Vitamin D Deficiency: Defining, Prevalence, Causes, and Strategies of Addressing
Calcified Tissue International https://doi.org/10.1007/s00223-019-00559-4
Kevin D. Cashman k.cashman @ ucc .ie
Cork Centre for Vitamin D and Nutrition Research, School of Food and Nutritional Sciences, University College Cork, Cork, Ireland
📄 Download the PDF from Sci-Hub via VitaminDWiki
Long winters without any Vitamin D from the sun
<400 IU daily in a majority of Europe
A few countries now allow/require fortification of oils and wheat, none in Europe

There are variable definitions of vitamin D deficiency, based on different thresholds of serum 25-hydroxyvitamin D (25(OH) D); this has a major bearing on the prevalence estimates of vitamin D deficiency and consequently on the magnitude of the public health issue of low vitamin D status. Despite this, there is widespread acknowledgement of the presence of vitamin D deficiency, even using the most conservative serum 25(OH)D threshold of < 25/30 nmol/L, in both low- and high-income country setting and the pressing need to address this deficiency. While ultraviolet B-rich sunlight stimulates synthesis of vitamin D in skin, there are environmental factors and personal characteristics which prevent or impede such dermal synthesis. There are several complexities and concerns in advocating sun exposure as a public health approach for increasing vitamin D status. This places increased emphasis on addressing vitamin D deficiency through dietary means. However, naturally rich sources of vitamin D are few and infrequently consumed, and nutrition surveillance data from various countries have indicated that habitual vitamin D intakes in the population are much lower than the recommendations. There are a number of strategies that can be considered for the control of micronutrient malnutrition, these include
(i) increasing the diversity of foods consumed,
(ii) food fortification, and
(iii) supplementation.
The present narrative review will consider these strategies for addressing low dietary vitamin D intake and consequently lowering the risk of vitamin D deficiency.
Introduction
Over the last decade, there has been exceptional interest from all quarters in relation to the role of vitamin D in human health and disease, and in the possibility that improving vitamin D status would bring benefits in relation to not only skeletal, but also a myriad of non-skeletal health outcomes. During the same timeframe, there have been differences of opinion and, in some cases, heated debate, in relation to the strength of evidence to support the role of vitamin D in non-skeletal health outcomes in particular and also on the serum 25-hydroxyvitamin D (25(OH)D; the most appropriate indicator of vitamin D status [1]) concentration which best supports good health [2, 3]. Some of the differences of opinion have stemmed from differing interpretation of the vitamin D research output over the period, which has and continues to amass at a phenomenal rate. For example, in the period 2008 to 2018 alone, a PUBMED search using all fields highlights nearly 39,000 scientific articles with the word ‘vitamin D’. The present narrative review will not deal with health effects of vitamin D, as these are expertly covered elsewhere within the special edition, but rather it will try and help the reader get an appreciation of the variable definitions of vitamin D deficiency based on different thresholds of serum 25(OH)D. These differing definitions have a major bearing on the prevalence estimates of vitamin D deficiency and consequently on the magnitude of the public health issue of low vitamin D status. The review will provide data on the prevalence of low vitamin D status in the general population, both in lower- and high-income settings. The review will also briefly overview the causes of vitamin D deficiency and, importantly, consider a number of strategies for addressing vitamin D deficiency, in particular through improving vitamin D intake. Such safe and sustainable strategies to prevent vitamin D deficiency across the population are of key public health priority.
This narrative review was compiled using data and information available from a number of key international vitamin D recommendation reports in relation to vitamin D deficiency and defining vitamin D status as well as PUBMED searches by the author of the available literature in relation to studies on the prevalence of low vitamin D status and on food-based solutions for addressing inadequate vitamin D intakes and status.
Defining Vitamin D Deficiency and Other Degrees of Low Vitamin D Status
While there is consensus that serum/plasma 25(OH)D concentration should be used to assess vitamin D status because it reflects the contribution from both diet and dermal synthesis [1, 2, 4], there has been considerable debate on its suggested thresholds (cut-offs) to define low vitamin D status [5]. While previously a range of 12.5-120 nmol/L was being discussed among experts [6], this has been refined in general to encompass 25-75 nmol/L [2-4]. Some of the variability in threshold concentration relate to differences in the associated severity of low vitamin D status, ranging from vitamin D deficiency, inadequacy to insufficiency, while some of it just relate to difference of opinion among expert groups on the threshold applied to even the same degree of low status. This is despite the fact that in nearly all cases, the thresholds relate primarily to musculoskeletal health outcomes. In relation to vitamin D deficiency as it relates to nutritional rickets and osteomalacia, the majority of expert bodies have suggested that serum 25(OH)D concentrations < 25 or < 30 nmol/L are indicative of increased risk [2, 4, 7-9].
There may be special considerations in relation to the serum 25(OH)D threshold(s) as applied to defining vitamin D deficiency in certain clinical patient groups. For example, the Endocrine Society Task Force on Vitamin D in the US [3], as part of their clinical practice guidelines, suggests that individuals should be identified as vitamin D-deficient at a serum 25(OH)D cut-off level of 50 nmol/L. Their guidelines, intended as reasonable recommendations for clinical care, also suggest that in terms of screening for individuals at risk of such vitamin D deficiency, candidates would include patients with rickets, osteomalacia, osteoporosis, chronic kidney disease, hepatic failure, malabsorption syndromes, hyperparathyroidism, granuloma-forming disorders, some lymphomas, patients using particular medications that may interfere with vitamin D, as well as other potentially at-risk groups, such as ethnic subgroups, obese, pregnancy, and lactation [3].
From a more population health perspective, and as distinct from clinical care guidelines, several, but not all, expert bodies briefed with development of dietary recommendations for vitamin D, again using bone health as the primary basis, proposed 50 nmol/L as the concentration of serum 25(OH)D that would meet the physiological vitamin D requirement of nearly all (i.e. the vast majority, if not 97.5%) ‘normal healthy persons’ [2, 7, 10, 11]. For example, the Institute of Medicine (IOM) in the US selected calcium absorption, bone mineral density (BMD), and either rickets in children or osteomalacia in adults, for which the evidence was sufficiently strong, for development for their vitamin D recommendations, called Dietary Reference Intakes (DRI) [2]. The DRI committee established 50 nmol/L as its estimate of the serum 25(OH)D concentration that would meet the requirement of nearly all (i.e. 97.5%) “normal healthy persons”, and which thus formed the basis of the establishment of their Recommended Dietary Allowance (RDA) (15 ug/days from 1 to 70, and 20 ug/days for those over 70) [2]. While the Scientific Advisory Committee on Nutrition (SACN) in the UK also selected musculoskeletal health (rickets, osteomalacia, falls, muscle strength, and function, depending on age group) for development for their vitamin D recommendations, called Dietary Reference Values (DRV), they considered that the evidence overall suggested the risk of poor musculoskeletal health was increased at serum 25(OH)D concentrations below ~ 20-30 nmol/L [4]. On this basis, SACN used a serum 25(OH)D target of 25 nmol/L to represent a ‘population protective level’ in that it is a concentration that individuals in the UK should be above, throughout the year, in terms of protecting musculoskeletal health. They established a Reference Nutrient Intake (RNI, their RDA equivalent, and covering the needs of 97.5% of individuals) for age-groups aged 4 years and above of 10 ug/ days [4]. Greater detail on the reasons why these DRI/DRV for vitamin D differ is provided elsewhere [12].
It is important to note that the suggested 50 nmol/L is not intended for vitamin D deficiency diagnostic purposes, but used to underpin the vitamin D intake-status relationship on which dietary recommendations are established [12]. Also within the framework of vitamin D recommendations, serum 25(OH)D concentrations greater than 30 but less than 50 nmol/L represent risk of inadequacy/insufficiency for some in the population, whereas concentrations greater than 50 nmol/L represent sufficiency for nearly all [2, 10].
Thus, while universal agreement on the definition of vitamin D deficiency is yet to be reached, overall it is generally agreed that we do not wish to have individuals in the populations (patient or otherwise) with circulating concentrations < 25/30 nmol/L, and that prevention of such vitamin D deficiency is a public health priority.
Prevalence of Low Vitamin D Status in the General Population
Ideally, estimates of the prevalence of vitamin D deficiency and low vitamin D status within the general population are derived from relatively recent nationally representative population-based surveys. While not feasible for all such surveys, if the serum 25(OH)D data from these studies are standardized, as pioneered by the US National Institutes of Health-led Vitamin D Standardization Program (VDSP) in terms of limiting the impact of analytical method-related differences in serum 25(OH)D measurement [13], the estimates are even more trustworthy, and especially if these are intended to be compared across countries/regions.
Estimates of the prevalence of vitamin D deficiency (based on data of VDSP standardized serum 25(OH) D < 30 nmol/L) in representative population samples in the US (n = 15,652) [14], Canada [15] (n = 11,336), and Europe (n = 55,844) [16] have been reported recently as 5.9, 7.4, and 13%, respectively. These are whole-population estimates and the prevalence can vary by age grouping with a tendency for it to be lowest in childhood and possibly later life [15, 17, 18] (see Fig. 1). In terms of vitamin D inadequacy, the average yearly population prevalence of standardized serum 25(OH)D < 50 nmol/L in the US, Canada, and Europe is 24.0, 36.8, and 40.4%, respectively [14-16]. While the US and Canadian data are based on the National Health and Nutrition Examination Survey (NHANES) 2007-2010 and the Canadian Health Measures Surveys (CHMS) Cycle 1 and 2, respectively, the European estimate is based on a collection of 14 nationally or regionally representative studies gathered as part of the European Commission (EC)-funded ODIN vitamin D project [16]. While the project included nationally representative nutrition surveys from Ireland, the UK, and Germany, some member states in Europe do not have such nationally representative surveys. Thus, in the absence of such data, well-curated samples from regionally representative health surveys were used, as they can also achieve some degree of population coverage [16]. Furthermore, while it was feasible to include data from numerous European countries, for several others data were not available. For example, a recent systematic review from the project highlighted that many countries in the Central and Eastern European region, including Albania, Belarus, Bosnia and Herzegovina, Bulgaria, Latvia, Macedonia, Moldova, Montenegro, and Slovakia had no published data on vitamin D status, let alone national survey data that might be standardized [19].
It should also be stressed that the above-mentioned prevalence data, based on average yearly population-wide estimates, do not capture the differences by ethnicity in these regions, which can be significant. For example, across ethnic groups in NHANES 2007-2010, the prevalence of serum 25(OH)D <30 nmol/L in non-Hispanic white, Hispanic, and non-Hispanic blacks have been reported as 2.3, 6.4, and 24%, respectively [14]. A recent analysis of ethnic differences within CHMS Cycles 1-3 showed that the prevalence of serum 25(OH)D < 30 nmol/L was only 6% in white versus 20% in non-white Canadians [20]. Dark-skinned ethnic groups within Europe are also worryingly at much increased risk of vitamin D deficiency compared to their white counterparts (prevalence < 30 nmol/L in the range 28-65%, depending on the country and the ethnic group) [16, 21].
Notwithstanding the important ethnic differences, even a crude estimation based on the magnitude of populations in the US, Canada, and Europe coupled with the above population-wide prevalence estimates suggest something in the region of 120 million individuals deficient [22]. As troubling as these estimates from high-income setting countries are, a recent systematic review of vitamin D deficiency in low- and lower-middle income countries (LMICs) has shown that there are a number of countries with extremely high prevalence rates of vitamin D deficiency [23]. Based on published data, which were not standardized, there was good evidence that the burden of vitamin D deficiency was excessive (as defined as a prevalence of 25(OH)D < 25/30 nmol/L in greater than 20% of the entire population or a population subgroup(s) [24]) in Mongolia, India, Pakistan, Afghanistan, and Tunisia [23]. Taking India as the most populous of the 5 LMICs highlighted, based on reported prevalence of serum 25(OH)D < 25 nmol/L in children (31%) in addition to adults and older adults (56-65%) [23], accounting for the countries’ age structure demographics [25], this may represent ~ 490 million vitamin D-deficient Indian individuals.
Thus, overall, data from lower- and high-income settings suggest, even using the lowest threshold of serum 25(OH)D < 25/30 nmol/L, let alone using higher suggested thresholds, strategies for vitamin D deficiency prevention are required.
Causes of Vitamin D Deficiency
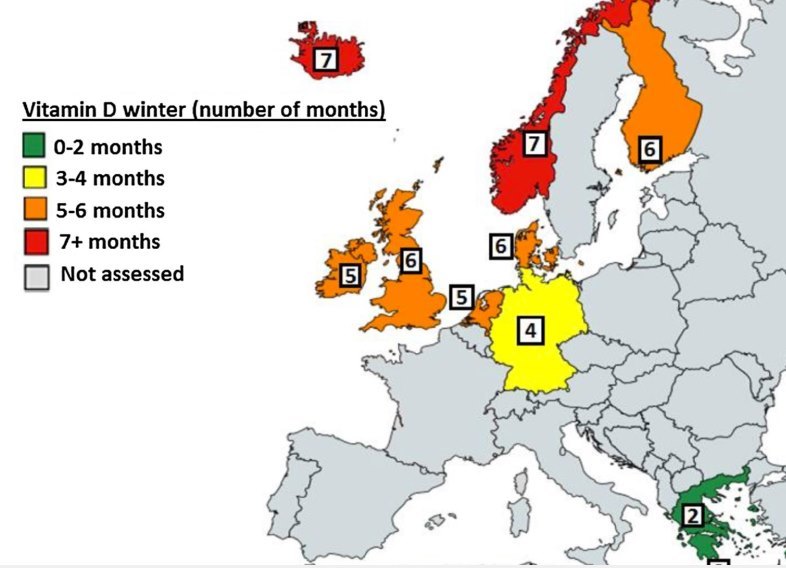
There is no one single underlying reason for vitamin D deficiency, but the combination of low ultraviolet B (UVB) availability and/or exposure coupled with a low dietary vitamin D supply are of key importance. The major source of vitamin D in humans is via the action of UVB radiation (290-315 nm) in sunshine on skin [2], with estimates of cutaneous synthesis providing 80-100% of the vitamin D requirements of the body [26]. However, there are several environmental factors that impede year-round synthesis, such as season, latitude, and prevailing weather conditions, which determine the availability of UVB of sufficient intensity to stimulate the conversion of 7-dehydrocholesterol in the skin to pre-vitamin D3. This vitamin D-effective UVB availability was recently modelled for nine European countries/regions using a validated UV irradiance model [27]. The results showed that UVB availability decreased with increasing latitude (from 35 to 69°N), while all locations exhibited significant seasonal variation in UVB. The number of months in which UVB availability was too low to allow for skin synthesis of vitamin D, referred to as the “vitamin D winter”, was estimated to range from being largely absent in the very south of Europe to lasting for as long as 7 or 8 months in northern Europe (see Fig. 2). Beyond vitamin D-effective UVB availability, personal characteristics, such as skin pigmentation, age, attire, sunscreen usage, working environment, outdoor physical activity, and sun exposure behaviour, can also prevent or impede vitamin D synthesis [2, 28]. For example, melanin in skin reduces the penetration of UVB and thus contributes to lower vitamin D status in dark-skinned individuals [29]. Dermal synthesis of vitamin D is less efficient in older than in younger adults [30].
Fig. 2 The number of months of the ‘vitamin D winter’ within a selection of European countries/ locations (courtesy of the ODIN project [95])
In the absence of sufficient UVB availability/exposure to enable synthesis in the skin, dietary supply of vitamin D is critical to meeting population requirements and prevention of vitamin D deficiency.
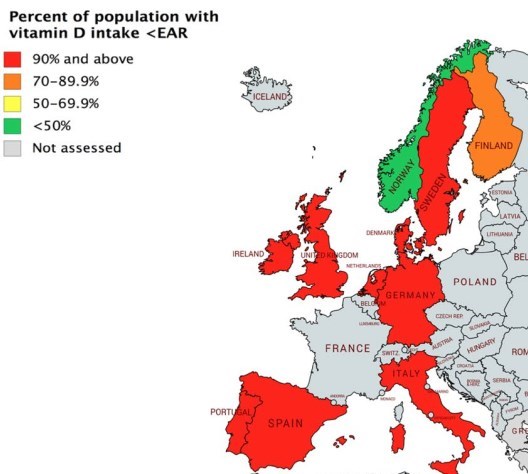
Fig. 3 The percentage of the population in the US, Canada, and a selection of European countries with vitamin D intakes below the Estimated Average Requirement (generated using data from national surveys [33-36])
Vitamin D does occur in the diet, both naturally and as an added nutrient for fortification, and in nutritional supplements (see below). However, typical vitamin D intakes in populations within the EU and US are generally around 3-8 ug/days, on average, depending on the country [31], and likely lower in many LMICs [23]. There is a significant gap between these typical intakes and the Estimated Average Requirement (EAR) for vitamin D of 10 ug/days for those aged > 1 year [2]. The percentage of the population with a habitual daily nutrient intake lower than the EAR is taken as an estimate of the percentage of the population with probable inadequate intakes [32]. On this basis, as can be seen in Fig. 3, the vast majority of individuals in North America and Europe, with the exception of some Nordic countries, have inadequate intakes of vitamin D [33-36]. While nationally representative data on vitamin D intake in other parts of the world are less available, similarly high percentages of the population with intakes less than the EAR are also almost a certainty. Thus, the current dietary supply of vitamin D is unable to offset the widespread deficit of UVB-induced synthesis in the skin, and furthermore, makes it unfeasible for most children and adults in Europe, many in North America and likely many elsewhere to meet the 10 ug/days target on a population basis.
There are other potential factors that will contribute to increased risk of vitamin D deficiency such as obesity and inflammation [3, 37, 38], among others. There are also clinically related underlying reasons contributing to risk of vitamin D deficiency in some patient groups, such as patients with fat malabsorption syndromes, bariatric surgery, nephrotic syndrome, among others as mentioned above, as well as patients on a variety of medications which may interfere with vitamin D [3].
Prevention of Vitamin D Deficiency and Addressing Inadequacy of Vitamin D Intake
As mentioned above, while vitamin D is obtained primarily through cutaneous biosynthesis in the presence of UVB sunlight of sufficient strength, during the vitamin D winters in latitudes greater than ~ 40°, little or no vitamin D is synthesized. Even beyond winter, there are also many reasons why summertime sun exposure may be inadequate, and these vary with the setting. As excessive sun exposure is the principal risk factor for most skin cancers, public education campaigns recommend limiting exposure to sunlight. Improved adherence to sun safety recommendations and awareness of the links between excessive sun exposure and skin cancer, as well as premature wrinkles, has led to the widespread use of sunscreen and inclusion of sun protection factor (SPF) ingredients in cosmetic products [39]. Correct application of a product containing an SPF of 15 almost completely prevents production of pre-vitamin D3 in the skin [40], even though many people fail to apply the correct amount of sunscreen and thus may make some vitamin D [41]. In some countries, cultural practices and traditional clothing as well as heightened avoidance of sun by females in particular, all limit dermal synthesis [23]. The variability between individuals, within and across ethnic groups, with respect to synthesis of vitamin D in the skin on exposure to the same dose of simulated summer UVB radiation has been shown to be large [42], with little information on the associated impact in relation to skin damage. Thus, for these various reasons, summertime sun exposure cannot be suggested from a public health approach for increasing vitamin D status, even in sunny countries. This places increased emphasis on addressing vitamin D deficiency through dietary-based means.
The World Health Organisation-Food and Agriculture Organization (WHO-FAO) have suggested that there are a number of strategies that can be considered for the control of micronutrient malnutrition [43]. These include (i) increasing the diversity of foods consumed, (ii) food fortification, and (iii) supplementation. The remaining sections of this review will briefly consider each of these in terms of means of addressing inadequate intake of vitamin D. While the EAR of 10 ug/days [2], as mentioned above, has been used as the benchmark for determining the prevalence of inadequacy of vitamin D intake within the population, an intake of 10 ug/days will also maintain serum 25(OH)D > 25 nmol/L in nearly all (97.5%) individuals [44]. The 97.5% arises from the distribution of nutrient requirements in which the convention is that the average requirement plus two standard deviations will cover the needs of nearly all [12]. Should one aim to maintain serum 25(OH)D > 25 nmol/L in 95% of individuals, the intake target becomes 7.5 ug/days, whereas maintaining 95% or 97.5% of individuals over the higher serum 25(OH)D threshold of 50 nmol/L would require vitamin D intakes of the order of 23.5 and 26 ug/days, respectively [44]. These target intakes colour the likelihood of success of the three WHO-FAO-defined strategies.
Vitamin D Supplement Use as a Means of Addressing Low Vitamin D Status
There have been calls for use of vitamin D supplements as a means of correcting low vitamin D intakes and status in the population, and vitamin D supplement use has been recommended as national policy in certain countries, particularly for at-risk population groups [45, 46], especially infants [8, 9]. This is not surprising in light of the tangible lines of evidence that vitamin D supplementation can significantly improve vitamin D intake and status [47]. The WHO-FAO suggest that of the three options that are aimed at increasing the intake of micronutrients, programmes that deliver micronutrient supplements often provide the fastest improvement in the micronutrient status of individuals or targeted population [43]. Supplementation has the advantage of being capable of supplying an optimal amount of a specific nutrient or nutrients, in a highly absorbable form, and is often the fastest way to control deficiency in individuals or population groups that have been identified as being deficient [43]. Within the hierarchy of evidence pyramid, systematic review and meta-analysis sit at the very top as they are considered high quality of evidence, with low risk of bias. There have been a number of systematic reviews and meta-analyses of vitamin D randomized controlled trials (RCT) which highlight the effectiveness of vitamin D supplementation in terms of improving vitamin D status across a variety of age, race, ethnic, and gender groups [1, 48-50]. This is irrespective of whether supplementation is with vitamin D2 or D3, albeit the latter proving to be modestly better [49]. Beyond the controlled setting of RCTs, at a more population level, there is also evidence from nationally representative surveys, which stratify participants by whether they consumer vitamin D-containing supplements or not, that show the difference in terms of status and prevalence of low vitamin D deficiency between the groupings. For example, data from NHANES 2007-2010 show that the mean serum 25(OH)D was 62.5, 72.0, and 82.0 nmol/L for those with 0 (n = 10,926), <10 (n = 1889), and > 10 ug/days (n = 2726) of supplemental vitamin D, respectively [14]. Data from CHMS 2007-2009 showed that in both winter and summer, supplement users (69.3% took < 10 pg) had higher mean serum 25(OH)D concentrations than did non-users, and within the total sample, irrespective of season, 2.9% (n = 34) versus 6.6% (n = 236) of supplement users and non-users, respectively, had serum 25(OH)D < 30 nmol/L [51].
Despite this, however, relying on supplements as an appropriate public health strategy to increase intakes across the population distribution has intrinsic limitations because supplements are only effective in those who consume them, and their uptake across the population is usually lower than ~ 40%, on average [33, 36, 51]. Supplement use tends to be highest among infants and elderly adults and lowest among children, adolescents, and young adults [52]. In the US, a recent assessment of trends in daily supplemental vitamin D intake of 25 ug or more, from 1999 through 2014, within adults > 20 years in NHANES shows a significant overall increase from 0.3 to 18.2%, and more evident in older adults (30.9% and 38.5% in 60-69 and > 70 years, respectively, in 2013-2014 as compared to 8.0% and 16.8% in 20-39 and 40-59 years, respectively, the same year) [53].
It is also important to remember that vitamin D is a nutrient, and many authors now acknowledge that it is best taken in moderate amounts on a frequent, regular basis [54]. Intermittent, high-dose regimens only correct deficiency in the short term and may have unintended adverse effects. For example, at least two RCTs with high-dose vitamin D supplementation (single annual dose of 12,500 ug vitamin D3 in autumn/winter; 1500 ug vitamin D3 monthly) reported increased risk of fractures and falls [55, 56]. The NHANES assessment of trends in supplementation shows that daily supplemental vitamin D intake of 100 ug (the current Tolerable Upper Intake Level for vitamin [2]) or more prior to 2005-2006 was less than 0.1%, but thereafter climbed to 3.2% in 2013-2014 [53]. While the usefulness of supplements under medical supervision for immediate correction of clinical deficiency (serum 25(OH)D < 30 nmol/L) has been acknowledged, it has also been emphasized that public health strategy must be designed to meet the needs of the unsupervised majority, on an on-going basis [54].
Increasing the Diversity of Foods Consumed and Improving Intake of Naturally Occurring Vitamin D-Rich Foods
In a general sense, increasing dietary diversity is the preferred way of improving the nutrition of a population because it has the potential to improve the intake of many food constituents—not just micronutrients—simultaneously, and is potentially the most sustainable option [43]. Increasing dietary diversity means increasing both the quantity and the range of micronutrient-rich foods consumed [43], however, in the context of vitamin D, this is particularly challenging because there are very few food sources rich in vitamin D. For example, out of ~ 2000 food codes in the UK McCance & Widdowson’s Food Composition database [57], only 3, 1, and 1% of foods have vitamin D contents in the range 1.5-5, 5-10, and > 10 ug/100 g, respectively. In addition, most of naturally occurring vitamin D-rich foods are not frequently consumed by many in the population [36]. The WHO-FAO also suggest that increasing dietary diversity is not without its limitations, the main one being the need for behaviour change and for education about how certain foods provide essential micronutrients and other nutritive substances [43]. A lack of resources for producing and purchasing higher quality foods can sometimes present a barrier to achieving greater dietary diversity, especially in the case of poorer populations [43]. These resonate in the case of vitamin D. For example, in terms of education, while it has been oft suggested, even within the 2011 Endocrine Society clinical guidelines [3], that chicken egg yolk contain something in the region of ~ 0.5 ug vitamin D per yolk, the UK food composition database would suggest it is closer to 2.3 ug/yolk (based on the database’s reported content of 12.8 ug/100 g yolk [57], and a typical yolk weight being 18 g). This difference is likely due to fact that the UK food composition database includes measurement values for vitamin D3 and 25-hydroxyvitamin D3 in certain animal- derived foods. Thus, egg consumption, as part of the healthy eating guidelines, can make a nutritionally relevant contribution to vitamin D intake in high-income countries. FAO food balance sheet data, averaged over a 10-year window (2004-2013) [58], suggest that the average per capita egg supply in Ireland, UK, and the US was 23, 29, and 39 g/ day, respectively. In contrast, average per capita egg supply in Afghanistan, India, and Pakistan over the same period was just 2, 6, and 7 g/day, respectively [58]. Certain red meats can also provide in the region of 0.5-1.4 ug/100 g [57], and a typical serving size of beef and pork can provide 0.9 ug and 1.4 pg, respectively. That red meat contributes 16-25% to mean daily intake of vitamin D in some high- income countries [18, 36], is not well known. It should be emphasized, however, that differences exist in the extent of coverage of the vitamin D content, including 25(OH)D, of foods across different food composition tables [22], and this impacts on the estimate that meat and certain other foods make to the mean daily intake of vitamin D. Investment in the provision of quality food composition data for vitamin D compounds in different countries and world regions is of high importance. It is also important to note that the disparity in food supply between the high- and low-income settings is also evident for red meat [58]. Thus, in practice, however feasible it might be to increase dietary diversity in relation to vitamin D in high-income countries, in many LMICs, it will require the implementation of programmes that improve the availability and consumption of, and access to, different types of vitamin D-rich animal products in adequate quantities, especially among those who may be most vulnerable such as women and children. There have been some innovative approaches to increase production and consumption of such foods in poorer regions of the world. For example, the Global Alliance for Improved Nutrition (GAIN) through their ‘Marketplace for Nutritious Food’ platform provides access to knowledge, networks, and technical and financial assistance to help businesses in low-income countries use local agriculture to contribute to the fight against malnutrition [59]. One such example focusses on improving environments for availability of affordable poultry products to improve nutrition status of Rwandans [59].
Overall, as a consequence of the above-mentioned limitations, improving intake of naturally occurring vitamin D-rich foods and increasing the diversity of vitamin D-containing foods are arguably the least likely strategy to work, at least in the short- to medium-term.
Traditionally Vitamin D-Fortified Foods as a Means of Addressing Low Vitamin D Intake and Status in the Population
While the WHO-FAO suggest that micronutrient supplementation often provides the fastest improvement in the micronutrient status of individuals or targeted population, food fortification tends to have a less immediate but nevertheless a much wider and more sustained impact [43]. Furthermore, as the benefits are potentially large, food fortification can be a very cost-effective public health intervention [43]. However, the WHO-FAO also point out that the traditionally fortified food(s) needs to be consumed in adequate amounts by a large proportion of the target individuals in a population [43]. This traditional fortification (i.e. exogenous nutrient is added to the food in controlled amounts; whether on a mandatory or voluntary/optional basis) approach to increasing intakes of vitamin D within the population has been implemented by many countries [54].
The US and Canada have a long experience of traditional fortification of food, especially of milk/dairy foods and margarine, a practice which has its origins in these countries’ response to childhood rickets [31]. Calvo, Whiting, and colleagues have provided an excellent overview of the North American vitamin D fortification initiatives and regulatory frameworks [60-62]. Canada currently has mandatory fortification of milk and margarine with vitamin D as stipulated by the Canadian Food and Drug Regulations, while fluid milk in the US is not required to have vitamin D added unless the label declares that it is fortified, in practice almost all milk is fortified with vitamin D on a voluntary fortification basis [reviewed in 63]. The Food and Drug Administration (FDA) in the US has very recently approved an increase in amount of vitamin D that may be added as an optional ingredient to milk (as vitamin D3) and milk alternatives and yogurts made from edible plants (as vitamin D2)
. Calcium-fortified orange juices and drinks as well as certain cereal products can also be fortified in the US FDA regulations. Currently within Europe, fortification practices vary between countries and may be applied voluntarily by manufacturers or implemented by national legislation [54]. Milk/dairy, margarines, and fats spreads are fortified with variable quantities on a voluntary basis. Other foods, such as breakfast cereals and dried or evaporated milks, may also be fortified on a voluntary basis as per the 2006 European Union regulation 1925/2006/EC on the addition of vitamins and minerals to foods [54].
That many high-income countries have opted for mandatory or voluntary food fortification is not surprising in light of the tangible lines of evidence that it can significantly improve vitamin D intake and status [54]. There have been a two systematic reviews and meta-analyses of RCTs with vitamin D-fortified foods which highlight the effectiveness of food fortification in terms of improving vitamin D status [64, 65]. While these provide evidence at the highest level that food fortification increases 25(OH)D, in the RCT setting at least, the review authors identified the over-reliance on milk as a weak link in the evidence for efficacy of food-based fortification and recommended considering a more inclusive approach to commodity-based fortification, with careful consideration of the foods used and levels of additions applied
. While vitamin D-fortified milk and related dairy products are highly effective in raising serum 25(OH)D levels when consumed [64-66], and fortification of dairy products beyond that of fluid milk has been proven to be technologically feasible [67], the evidence from more population-based studies highlight potential pros as well as cons. For example, data on vitamin D status of Canadians who are not supplement users indicate that ingestion of at least 1 serving/day of fortified milk is associated with increments in serum 25(OH) D levels of at least 6 nmol/L per serving from November through April compared with non-milk consumers [62, 68]. El-Hayek et al. [69] showed that 25(OH)D concentrations in pre-school children in Montreal increased in a step-wise manner by tertile of milk intake. However, among the wider population, with increased variability in milk consumption, the situation becomes more complex. In the US, data on vitamin D intakes from individuals aged > 2 years in the NHANES 2003-2006 showed that the mean intake of
ug/days from natural food sources only was increased to ug/days when foods with vitamin D enrichment/fortification were accounted for [33]. Likewise, in Canada, mean vitamin D intakes arising from milk products in those aged > 9 years was in the range of 2.5-3 ug/days, contributing 49.1% to the mean daily intake of vitamin D [60]. However, in both the US and Canada, the prevalence of inadequate vitamin D intakes (i.e. < EAR) remains very high [33, 60], highlighting the variable rates of consumption. Interestingly, modelling data from the nationally representative 2004 Canadian Community Health Survey 2.2 (n = 34,381) showed that this prevalence dietary inadequacy of vitamin D could be decreased from > 80% (even with mandatory fortification) to < 50% in all groups with increased vitamin D levels in milk and the addition of vitamin D to cheese and yogurt at various levels [60]. Such evidence informed the recent decision in Canadian to revise upwardly the approved levels of addition of vitamin D to milk and margarine [70].
From a European perspective, Finland is the country with the most progressive vitamin D food fortification programme. In February 2003, the Finnish government introduced regulations for the optional fortification of milks and yogurt (at level of 0.5 ug vitamin D3/100 g) as well as margarine and spreads (10 ug vitamin D3/100 g) [71]. The representative National FINDIET 2012 Survey, as the most recent nutrition survey in Finland, shows that that milk and fat spreads contribute in the region of ~ 40% and ~ 25% of the mean daily vitamin D intake of adults aged 25-74 [72], and the mean intake increased from 5 to 17 ug/day in men and from 3 to 18 ug/day in women from 2002 to 2012 [73]. A recent comparison of standardized serum 25(OH)D data from the Finnish Health surveys in 2000 (n 6134) and 2011 (n 4051) shows that the mean serum 25(OH)D increased from 48 to 65 nmol/L, and prevalence of serum 25(OH)D < 30 nmol/L decreased from 12 to < 1% [74]. In other European countries where fortification of milk is voluntary and the uptake is far less than in the US or Finland, the impact of vitamin D-fortified milk and dairy on adequacy of intake of the vitamin is understandably low. For example, data from national nutrition surveys in the UK and Ireland show that in general the percentage contribution that milk and dairy makes to the mean daily intake of vitamin D are low (< 7%) for those aged 11 y upwards in both populations [18, 36].
Data from the most recent national dietary survey in 2010 show that only about 17% of Irish adults, aged 18-64 year, used vitamin D-fortified milks, however, that is up from 5% ten years prior [36]. Currently, with market penetrance and current levels of addition, it is not surprising to find that in Europe in general the intake of vitamin D from voluntary fortified foods has been reported as low [75].
The problem of fortifying a single food staple, e.g. milk, or focusing on a commodity sector such as dairy, is that it does not increase the vitamin D supply in non- or low consumers [76]. Thus, while acknowledging the valuable contribution fortified milk makes to vitamin D intakes among consumers, particularly in children, and the continued need for fortification of milk and other dairy products, it has been suggested that additional strategic approaches to fortification, including potentially biofortification (see below), of a wider range of foods, have the potential to increase vitamin D intakes in the population [31, 76]. In terms of diversification of food fortification to include cereal products, Madsen et al. [77] provided experimental evidence, in the form of data from a large, well-characterized RCT, of the effects of vitamin D-fortified milk and bread on serum 25(OH)D in 201 families (n = 782 children and adults, aged 4-60 years) in Denmark during winter. Bread was included as an additional vehicle for fortification in recognition of the skewness of milk intake across some population groups. The groups randomized to vitamin D unfortified and fortified foods had median intakes of vitamin D of 2.2 and 9.6 ug/day, respectively, over the 6 months of the study. By the end of the study period, none and 16% in the fortified food group had serum 25(OH)D levels below 25 and 50 nmol/L, respectively, with the corresponding prevalence estimates for the group receiving unfortified foods at 12% and 65%, respectively [77]. Allen et al. [78] recently modelled the impact of a number of simulated vitamin D fortification scenarios, with milk and wheat flour identified as primary fortification vehicles, on vitamin D intake distribution within the first 2 years (2008-2010) of the UK National Diet and Nutrition Survey (NDNS) rolling programme (n = 2127 individuals). At a simulated fortification of 10 ug vitamin D/100 g wheat flour, the proportion of at-risk groups estimated to have vitamin D intakes below the UK Reference Nutrient Intake was reduced from 93 to 50% [78]. Interestingly, the simulation of the fortification of wheat flour at this concentration was more effective than that of the fortification of milk (at concentrations between 0.25 and 7 ug vitamin D/100 L milk) or of the fortification of milk and flour combined. The authors suggested that vitamin D fortification of wheat flour could be a viable option for safely improving vitamin D intakes and the status of the UK population groups at risk of deficiency [78]. The safety profile of vitamin D-fortified milk and/or bread in terms of risk of intakes exceeding the UL for vitamin D in the population modelling exercises has been shown to be very good [60, 78].
More globally, a number of countries have legislation and/or food standards that provide guidance/regulations for fortification of food with vitamin D on a voluntary or mandatory basis (see Fig. 4). Currently, 10 countries mandate (five) or allow voluntary (five) co-fortification of edible oils with both vitamins A and D [79]. No country mandates or allows fortification of oil with vitamin D without also mandating or allowing oil fortification with vitamin A [24]. While co-fortification of vitamin A-fortified foods with vitamin D is widely regarded as a cost-effective strategy for improving vitamin D intake, the efficacy of this strategy in raising population 25(OH)D is unknown [24]. Three countries have mandatory fortification of wheat flour with vitamin D, whereas two more have voluntary fortification [79].
In light of recent calls for a radical transformation of the global food systems, with emphasis on increased consumption of plant-based foods and reductions in dairy and meat for many as part of a more sustainable flexitarian type diet [80, 81], the fortification of non-animal-derived foods, such as cereals, bread, edible oils, and possibly biofortification of fungi and baker’s yeast (see next section), with vitamin D may be of increasing importance for the World’s population.
While the WHO-FAO emphasize food fortification with vitamin D as offering the widest and likely more sustained impact at a population level, they also highlight that various challenges/barriers to its success may exist, depending on the setting [43]. Among these are cost and consumer barriers. Adding extra vitamin D into foods will incur a cost, however, for the most part this is likely to be low, at least for the consumer. For example, flour fortification with vitamin D at 550 IU [13.7 pg]/kg of flour only adds a very modest cost of US$0.04-0.05 per metric ton of flour (Personal communication Quentin Johnson, Food Fortification Initiative, www.ffinetwork.org). Depending on how fortification is approached, e.g. mandatory versus voluntary, there may be a variable cost to the producer. For example, in the case of a large-scale centralized fortification of a staple, i.e. fortification that is carried out in just a few large industrial units, the purchase price of micronutrients accounts for at least 80-90% of the total fortification cost, whereas in the case of fortification being carried out by multiple, smaller- scale enterprises, both the initial investment costs (e.g. in equipment, if required) and the running costs (e.g. of quality control procedures) are proportionally higher, a factor which might hinder the feasibility and sustainability of a fortification programme [43], again depending on the setting. The WHO-FAO have suggested that, notwithstanding these considerations, in many settings food fortification can be a very affordable way of correcting inadequate micronutrient intakes, and more often than not, the main challenge is finding a suitable industrially manufactured food vehicle that is consumed in sufficient amounts by the population at risk [43]. The cost and choice of food vehicle(s) are also important more considerations in terms of trying to ensure equality of access to these foods within the population.
The WHO-FAO have also detailed possible consumer barriers to fortified foods and products, but also highlight that various ways of communicating messages about the benefits of fortification do exist, including nutrition education, social marketing, and advocacy [43]. Of note, advocacy and education are among the high-level research agenda themes outlined recently by a working group convened in 2017 by the Sackler Institute for Nutrition Science at the New York Academy of Sciences and sponsored by the Bill & Melinda Gates Foundation, for the purpose of assessing the global prevalence and disease burden of vitamin D deficiency [24]. The importance of advocacy and education can be illustrated by the recent findings of a pilot study in the UK which explored awareness of vitamin D deficiency and attitudes towards food fortification among five vitamin D deficiency at-risk groups (i.e. South Asians, Blacks, Middle Eastern, Far Eastern, and Caucasian older adults over 65 years) [24]. The attitudes to mandatory fortification of some foods with vitamin D varied significantly between the groups, with acceptance rates ranging from 48% (South Asians) to 73% (Far Eastern). Data from the NDNS in the UK, albeit with low numbers of ethnic survey participants, showed that 59.6% and 35.7% of Black and Asian individuals, respectively, had serum 25(OH)D < 30 nmol/L, compared to 19.6% of white individuals [16]. In terms of a low-income setting, a recent study of the awareness and attitudes regarding industrial food fortification among adults in Mongolia, one of the 5 LMICs with a worryingly high prevalence of vitamin D deficiency [23], showed that 55% favoured mandatory fortification, 14% disapproved of it, and 31% were uncertain [83]. Of note, upon learning that the primary purpose of adding vitamin D to milk is to prevent rickets, 75% of Mongolians favoured mandatory fortification. Further research on attitudes towards vitamin D food fortification in various settings is clearly warranted.
Vitamin D-Biofortified Foods as a Complementary Approach to Traditional Fortification
While traditional fortification practices in which exogenous vitamin D is added to dairy and other foodstuffs will continue to be an important approach for increasing vitamin D in the food supply, the use of vitamin D-biofortified foods (also referred to as ‘bio-addition’ [62]) also merits serious attention [84]. In this approach, the animal-derived food produce has increased vitamin D and/or 25-hydroxyvitamin D contents by virtue of addition of vitamin D and/or 25-hydroxyvi- tamin D (where permissible) to the respective fish, livestock, or poultry feeds [22]. Biofortification with vitamin D could also embrace the practice of UV irradiation of mushrooms and baker’s yeast, which have been shown to stimulate their endogenous vitamin D2 content. The most researched, and arguably most promising, vitamin D-biofortified food to date is eggs. There is ample evidence that the vitamin D3 and/or 25-hydroxyvitamin D3 content of eggs can be significantly increased by the greater addition of vitamin D3 and/or commercially available 25-hydroxyvitamin D3 to the feed of hens [for review, see 22]. The WHO-FAO have suggested that access to and use of fortificants that are well absorbed yet do not affect the sensory properties of foods is important [43]. In terms of producing eggs that would be acceptable from a sensory perspective, we have recently demonstrated that additional vitamin D and/or 25-hydroxyvitamin D3 at levels adhering to the maximum allowable EU regulation, resulted in eggs with increased total vitamin D content (providing ~ 5 ug/egg), and, importantly, no deterioration of consumer acceptability of the biofortified eggs compared to usual eggs [85]. Thus, such vitamin D-biofortified eggs could supply half the EAR for vitamin D. Importantly, in terms of bioavailability/effectiveness, we have also recently shown in a winter-based RCT of older adults (n = 55) that weekly consumption of 7 such vitamin D-biofortified eggs prevented the typical decline in serum 25(OH)D concentration during winter and any incidence of vitamin D deficiency [85]. The control group in the study, who were requested to consume weekly up to a maximum of 2 commercially available eggs, had a significant decline in serum 25(OH)D over the 8 weeks of winter, and 22% had vitamin D deficiency (serum 25(OH) D < 25 nmol/L) at endpoint [85]. From a dietary guideline perspective, the general population can include up to seven eggs a week in their diet [86], and our RCT showed no difference in serum total cholesterol among control and vitamin D-biofortified egg groups [85].
The feasibility of producing other vitamin D-biofortified animal- and fungi/yeast-based foods has been demonstrated, with variable levels of improvement in vitamin D content over non-biofortified equivalent foods (see Table 1). In relation to biofortified meats, the increments in vitamin D content are relatively modest [87-89], and this is likely due to the fact that the transfer of additional vitamin D in feed- stuffs to tissues is under some degree of biological regulatory control mechanisms in the animal. Data from RCTs investigating the impact of consumption of vitamin D-bio- fortified meats on vitamin D status are as yet lacking. The UK food composition database suggests that the flesh (fillet) of farmed and wild salmon has been 4.7 and 8.6 ug/100 g, respectively [57]. Graff et al. recently compared the impact of consumption of biofortified versus control salmon (fish feed had 2.6-2.9 mg vitamin D3/kg vs. 0.23 mg vitamin D3/kg, respectively) on vitamin D status in a 12-week intervention trial in healthy postmenopausal women [90]. The women consumed 150 grams of salmon two times per week, with the vitamin D-biofortified and control groups consuming the vitamin D daily equivalent of 16 ug/day versus 3.9 ug/day, respectively, from the salmon. There was a significant increase in mean serum 25(OH)D of ~ 12 nmol/L in the vitamin D-biofortified groups versus a non-significant 1.3 nmol/L decline in the low vitamin D group over the 12-week intervention [90]. It should be noted, however, that the level of addition of vitamin D3 to the fish feed exceeded that is allowable currently by European legislation [1.5 mg/ kg diet; 91].
Unlike in the case of biofortified meats and fish, from a technological perspective, UV-irradiated foods can be produced with anything from low to very high levels of vitamin D2. While these foods may be a useful strategy to increase vitamin D intakes for vegetarians or those who do not consume meat or foods of animal origin for cultural reasons, the evidence from an a recent 8-week, winter-based RCT in healthy adult women in Finland suggests that the UV- exposed bakers’ yeast-derived vitamin D2, despite being present in the bread post-baking, was not bioavailable and thus did not improve status of the women [92]. The European Food Safety Authority have approved treatment with UV radiation of bread, after the baking process is complete
. This allows the ergosterol, which is present in bread as a result of yeast fermentation, to be converted to vitamin D2. However, the bioavailability of the vitamin D2 from this novel bread has not been examined thus far. The RCT data demonstrating that the vitamin D2 in UV-treated mushrooms can increase vitamin D status of consumers has been quite mixed [94]. Our systematic review and meta-analysis of the impact of UV-exposed mushrooms on serum 25(OH)D response in 6 identified RCTs showed serum 25(OH)D was not significantly increased by UV-exposed mushrooms, but there was high heterogeneity [94]. Including only the 3 European-based RCTs [mean baseline 25(OH)D, 38.6 nmol/L], serum 25(OH)D was increased significantly by UV-exposed mushrooms, whereas there was no significant effect in the 3 US-based RCTs [mean baseline 25(OH)D: 81.5 nmol/L]
. Thus, consumption of UV-exposed mushrooms may increase serum 25(OH)D when baseline vitamin D status is low via an increase in 25(OH)D2 and despite a concomitant but relatively smaller reduction in 25(OH)D3. However, when baseline vitamin D status is high, the mean increase in 25(OH)D2 and a relatively similar reduction in 25(OH) D3 explain the lack of effect on serum 25(OH)D [94]. This would need to be confirmed experimentally. As mentioned above, wider use of foods based on vitamin D-biofortified mushrooms and yeast, together with traditional fortification of plant-based food vehicles with vitamin D, could be increasingly important in the context of calls for wider adoption of a diet rich in plant-based foods and with fewer animal source foods. In addition, that the meat which does remain in the diet might have the highest content of vitamin D as possible, highlights the potential of biofortification.
Conclusion
While a number of definitions of vitamin D deficiency exist, prevention of serum 25(OH)D concentrations falling below < 25/30 nmol/L, which is prevalent still in some LMICs and high-income countries, is a public health priority. While there is merit in exploiting, where feasible, all three of the WHO-FAO suggested strategies for the control of micronutrient malnutrition [43], there is a good level of agreement that food fortification with vitamin D offers the widest and likely more sustained impact at a population level. It should be stressed that the likelihood of success of food fortification is contingent on the target vitamin D intake being 10 ug/day. As mentioned above, if the objective is to try and maintain the vast majority of individuals over a serum 25(OH)D threshold of 50 nmol/L, this would require vitamin D intakes of the order of ~ 25 ug/day, which would be difficult to achieve via food fortification alone. While an approach that gets vitamin D intakes in the population to ~ 10 ug/day offer maximal advantage in terms of preventing serum 25(OH)D dropping below 25 nmol/L in 97.5% of individuals, this represents a sizeable increase in intakes for many populations, especially from some LMICs. As mentioned above, the vitamin D intake target increases from 4.7 to 7.5 to 9.9 ug/day, in terms of maintaining serum 25(OH)D > 25 nmol/L in 90, 95 or 97.5% of individuals, respectively. Thus, even step-wise adjustments to get to the target intake of ~10 ug/day over a defined period of time will offer increasing degrees of population protection over that currently offered by the relatively low habitual intakes. Achievement of these required intakes, which would drive real-world progress in terms of tacking vitamin D deficiency, will not happen without the engagement of government and industry to implement the needed changes in the food chain in relation to vitamin D.