High poly-fat meal, raised vitamin D, low fat, lowered D
Effect of High- versus Low-Fat Meal on Serum 25-Hydroxyvitamin D Levels after a Single Oral Dose of Vitamin D: A Single-Blind, Parallel, Randomized Trial
Fabiana Viegas Raimundo,1 Gustavo Adolpho Moreira Faulhaber, 2 Paula Kalinka Menegatti, 2 Leonardo da Silva Marques,2 and Tania Weber Furlanetto 1,2
1 Programa de Pos-Graduafao em Medicina: Ciencias Medicas, Universidade Federal do Rio Grande do Sul, Rua Ramiro Barcelos 2400, 90035-003 Porto Alegre, RS, Brazil
2 Servico de Medicina Interna, Hospital de CHnicas de Porto Alegre, Rua Ramiro Barcelos 2350/700, 90035-903 Porto Alegre, RS, Brazil
Correspondence should be addressed to Tania Weber Furlanetto, taniafurlanetto@gmail.com Received 10 July 2011; Revised 15 September 2011; Accepted 16 September 2011 Academic Editor: Ajai Kumar Srivastav
Copyright © 2011 Fabiana Viegas Raimundo et al. This is an open access article distributed under the Creative Commons Attribution License, which permits unrestricted use, distribution, and reproduction in any medium, provided the original work is properly cited.
International Journal of Endocrinology Volume 2011, Article ID 809069, 5 pages doi:10.1155/2011/809069
PDF is attached at bottom of this page
Background/Aims.
Vitamin D3 is liposoluble, so dietary fat could increase its oral absorption. Our aim was to compare serum 25-hydroxyvitamin D [25(OH)D] after the oral intake of cholecalciferol with a high- or low-fat meal.
Methods.
In a single-blind, parallel clinical trial, 32 healthy physicians were divided into two groups. In the same day, they ingested 50,000 IU (1.25 mg) of vitamin D3 with food: group 1 (G1): lipids: 25.6g and group 2 (G2) lipids: 1.7 g. Serum 25(OH)D (0, 7, and 14 days), and parathyroid hormone (PTH), and calcium (0 and 14 days) were measured.
Results.
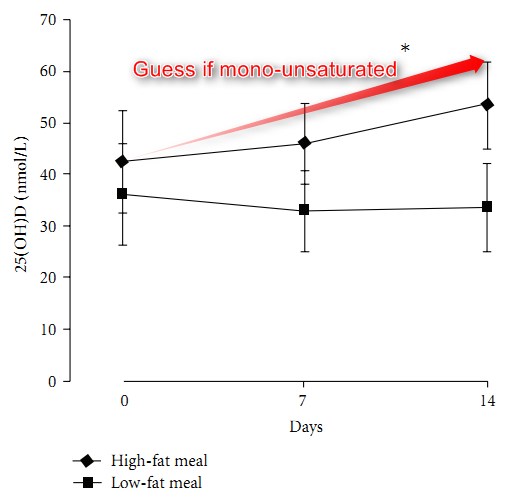
Baseline mean serum 25(OH)D levels were 42.7 ± 19.0 nmol/L in G1 and 36.4 ± 19.0 nmol/L in G2 (P = 0.38). After cholecalciferol, mean serum 25(OH)D was higher in G1 (P< 0.001): 7 days: G1 = 46.2 (38.4-53.9) nmol/L and G2 = 33.7 (25.4-40.1) nmol/L; 14 days: G1 = 53.7 (45.2-62.1) nmol/L and G2 = 33.7 (25.2 2.2) nmol/L. Serum PTH and 25(OH)D were negatively correlated before and after the intake of vitamin D3, respectively, r = -0.42 (P = 0.02) and r =-0.52 (P = 0.003).
Conclusions.
A high-fat meal increased the absorption of vitamin D3, as measured by serum 25(OH)D.
1. Introduction
Vitamin D is important for human health [1], and lower serum 25-hydroxyvitamin D [25(OH)D] has been associated with increased mortality [2]. Moreover, a high prevalence of vitamin D deficiency has been identified worldwide in recent years [3]. Dietary supplements are useful to prevent and treat this deficiency [4].
As vitamin D is liposoluble, its oral absorption could increase if ingested with a fat-rich meal. Although there are several studies about the effect of different ways to supply vitamin D in its serum levels [5-9] or in serum 25(OH)D levels [10-14], only a few of these studies describe the amount of fat ingested with vitamin D [7, 9, 11]. Therefore, the aim of this study was to compare serum 25(OH)D levels after the oral intake of cholecalciferol with a high- or low-fat meal in young adults.
2. Materials and Methods
This single-blind parallel randomized trial included 32 healthy resident physicians in Porto Alegre, latitude 30°, Brazil. Height and weight were measured to calculate body mass index (BMI: weight (kg)/height2 (m)). Two different groups were formed with 16 individuals, each according to sex and BMI, and randomly assigned to a high-(Group 1:G1) or low-fat meal (Group2:G2).The exclusion criteria were not drinking milk; BMI >30kg/m2 or <18.5kg/m2; known liver, kidney or endocrine disease; use of supplements of calcium and/or vitamin D; use of anticonvulsants, barbiturates, or glucocorticoids, and travel outside the Brazilian South region during the previous 120 days. Skin phototype was evaluated according to Fitzpatrick [15].
Persons invited and agreed to participate n = 40
Excluded:
_ travel to outside the Brazilian South region in the last 120 days n = 7 BMI >30 kg/m2 n = 1
Stratified blockrandomization
(BMI and sex)
Group 1 n = 16 Group 2 n = 16
25.6 g fat/meal 1.7 g fat/meal
- *
50IU vitamin D3 50IU vitamin D3
Included in the analysis n = 15 1 did not enter the protocol for forgetting appointment
Included in the analysis n = 15 1 did not enter the protocol for acute disease
Figure 1: Flow diagram of the participants. Abbreviation: BMI-Weight (kg)/Height (m)2.
Table 1: Nutritional composition of meals.1
Nutrients2
Group 1
Group 2
Lipids (%)
25.6 g (48.7)
1.7g(3.3)
Carbohydrates (%)
43.3 g (36.6)
95.5g(82.2)
Proteins (%)
17.2g(14.5)
16.8 g (14.4)
Fiber
1,5g
3,5g
Energy
473 kcal
465 kcal
1 According to the Brazilian Table of Food Composition [16].
2 Percentage of total calories in the meal.
The low-fat meal contained skim milk, white bread with fruit jelly, and fruit salad.
The high-fat meal contained whole milk, white bread with bologna, and vegetable oil margarine.
(Note by VitaminDWiki: High fat =high polyunsaturated. Would have had better response with a mono-saturated meal)
All participants came to the research unit on the same day at 7:00 AM, after overnight fasting. A blood sample was collected to measure 25(OH)D, parathyroid hormone (PTH), total calcium, albumin, magnesium, and creatinine, and a urine sample was collected to measure creatinine, calcium, and magnesium. Then, 50,000 IU of cholecalciferol in a capsule were administered by the oral route to each subject during a meal with high- or low-fat content(Table1). The subjects ingested the whole content of the meal, and then were advised to avoid sun exposure and changes in their usual eating pattern for the next two weeks. The researchers who collected the samples were blinded to the groups.
Overnight fasting blood samples were collected after 7 days for measurement of 25(OH)D and 14 days for measurement of 25(OH)D, PTH, and total calcium. Serum was kept at -70°C until the assay of 25(OH)D and PTH. All samples were analyzed in the same run: 25(OH)D by chemiluminescence (LIAISON, DiaSorin Inc., Stillwater/MN, USA, intra-assay coefficient of variation = 5.5%) and PTH by electrochemiluminescence (Roche Diagnostics, Indianapolis/IN, USA, intra-assay coefficient of variation = 2.8%).
The number of subjects, calculated to detect a 30% difference in mean serum 25(OH)D levels between groups, with a standard deviation of 7.7 ng/mL [17], power of 80%, and P<0.05, was 15 per group. One additional subject was included in each group to allow for losses.
Repeated measures ANOVA was used to compare mean serum 25(OH)D levels. Correlations were analyzed by the Pearson correlation coefficient. All data were analyzed with SPSSv.16.0, and differences were considered significant when P< 0.05. Cholecalciferol in powder (Taizhou Hisound Chemical Co. Ltd, Taizhou, Zhejiang, China) was provided by DEG Ativando Principios Company, Sao Paulo, SP, Brazil, which evaluated its content through HPLC (99.9%). The content of vitamin D3 in the capsules ranged from 48,170 – 52,777 IU. All of the vitamin D capsules contained lactose (82 mg) and crystalline micro cellulose (18mg). One International Unit (1 IU) of vitamin D is equal to 0.025 micrograms.
(Note by VitaminDWiki: most vitamin D comes in oil, not as a powder)
The study was approved by the Ethics Committee of HCPA, and participants were included after written informed consent.
3. Results
Forty resident physicians were invited to participate, and all agreed. Seven were excluded because they had traveled to regions with high UVB incidence in the last 120 days, and one was excluded for having BMI >30kg/m2. Two participants, one from each group, did not enter the protocol, for missing the first appointment: one forgot and the other was acutely ill. All others were included in the analyses (Figure 1). The study was conducted in October 2009.
Table 2: Baseline characteristics of the study groups.
Parameters
Normal Range
Group 1 (n = 15)
Group 2 (n = 15)
Males/females (n)
Age (yr) BMI (kg/m2)
Serum
25(OH)D (nmol/L)
PTH (ng/L)
Albumin (g/L) Calcium (mmol/L) Creatinine (^mol/L) Magnesium (mmol/L) Urine
Creatinine (mmol/L) Calcium (mmol/L) Magnesium (mmol/L)
14.0-72.0
34.0-48.0
2.1-2.5
44.2-106.1 0.7-1.1
6/9
27.5 ± 2.0
2.3 ± 2.8
42, 7 ± 19, 0 34.9 ± 9.9
46.0 ± 3.0
2.3 ± 0.1
79.6 ± 17.7
0.9 ± 0.04
17.92 ± 9.83
2.8 ± 1.7 4.1 ± 1.6
6/9
26.7 ± 1.7
2.5 ± 2.6
36,4 ± 19,0 31.0 ± 9.9 46.0 ± 3.0
2.3 ± 0.1
79.6 ± 17.7
0.9 ± 0.04
14.92 ± 5.31
4.1 ± 2.4 4.3 ± 1.9
Data are shown as number of participants (n)ormean± SD.
Abbreviations: BMI: body mass index; 25(OH)D: 25-hydroxyvitamin D; PTH: parathyroid hormone.
3 "o E
o
70 60 50 40 30 20 10
15
3 "o E
O
2
7
Days
14
-5
7
Days
High-fat meal Low-fat meal
High-fat meal Low-fat meal
(a)
(b)
With a single 50,000 IU vitamin D3 dose:
Good response with high fat meal (25 gram), negative response with low fat meal (2 gram)
(Title and second graph added by VitaminDWiki)
Figure 2: Mean serum 25(OH)D levels (a) and mean variation of serum 25(OH)D levels (b) were higher, after the intake of 50,000 IU of vitamin D3 with a high-fat meal (n = 15) when compared to a low-fat meal (n = 15). * P< 0.001, comparing the two slopes. Data are shown as mean and 95% confidence interval.
The baseline characteristics are shown in Table 2. Phototypes ranged from I to II. Serum 25(OH)D was <75 nmol/L in 28 subjects, <50 nmol/L in 21 subjects, and <25 nmol/L in 5 subjects. After cholecalciferol, mean serum 25(OH)D levels and mean variation of serum 25(OH)D levels were higher in G1 (P< 0.001), and the differences were significant at day 14 (Figures 2(a) and 2(b)).
At day 14, no one had hypercalcemia, and mean serum total calcium (G1: 2.3 ± 0.1 mmol/L and G2: 2.2 ± 0.1 mmol/L; P = 0.11) and PTH (G1: 33.1 ± 11.0ng/L;G2: 36.4 ± 9.0 ng/L, P = 0.37) were similar in both groups; the mean change in serum PTH was negative in G1 (-1.8 ± 7.2ng/L) and positive (5.5 ± 7.1ng/L) in G2 (P< 0.01). In all participants, serum PTH and 25(OH)D levels were negatively correlated at baseline and 14 days after the intake of vitamin D, as shown in Figure 3.
4. Discussion
The intake of 50,000 IU of cholecalciferol with a fat-rich meal increased mean serum 25(OH)D levels, in young adults.
A change in mean serum 25(OH)D levels was not observed in
5
3
60 50 40 30 20 10
0
0
r = -0.42 p = 0.02
20
4060
25(OH)D (nmol/L)
(a)
100
/L) g/
(n
(H
E60 50 40 30 20 10 0
? ?
r = -0.52
p = 0.003
20
40 60 25(OH)D (nmol/L)
(b)
80
100
Figure 3: Correlation between serum parathyroid hormone (PTH) and 25-hydroxyvitamin D [25(OH)D] levels, in young adults (n = 30), at baseline (a), and 14 days after the oral intake of 50,000 IU of vitamin D3 (b).
E
0
the group that received vitamin D along with low-fat food, and its increase in the group that received the high-fat meal was small. As a placebo group was not studied, it is possible that serum 25(OH)D levels were decreasing in the sample studied due to the season [18].
The improved bioavailability of cholecalciferol when administered with fat-rich food could be due to a higher release of bile, allowing an increased incorporation of fat in the bile salt micelle, and its absorption [19]. Few studies have evaluated the effect of dietary fat in the absorption of vitamin D. In a clinical trial that compared the effect of 25,000 IU of vitamin D2 intake with whole milk (8.4 g of fat/serving), skimmed milk (2.4 g of fat/serving), or toast with 0.1 mL of corn oil, there was no difference in mean serum vitamin D2 levels, which suggested that its absorption is not dependent on fat [9]. Nevertheless, the content of fat ingested was small in all groups, so serum vitamin D levels could have been higher if the vitamin had been ingested with more fat. In another study, normal individuals consumed low-fat cheese (~3 g of fat/serving) or high-fat cheese g of fat/serving), fortified with 28,000 IU of vitamin D, or the same amount of vitamin D dissolved in ethanol, with or without food, per week, for 8 weeks.
Mean serum 25(OH)D were similar in all groups treated with vitamin D and higher than placebo [14]. However, in these studies, the difference in the amount of fat provided by the meals for different groups was smaller than the one in the present study, and the total amount of fat offered in the meals was also smaller. Moreover, dissolving vitamin D in ethanol could have made its absorption easier.
In another study, higher mean serum vitamin D2 levels, in young and older adults, were observed when the vitamin was ingested with cheese (~20 g of fat/serving) when compared to water, suggesting that food facilitates its absorption, and is not affected by age [7]. In this study, the fat content of cheese was similar to the one provided in our study. A recent uncontrolled study found higher mean serum 25(OH)D levels when vitamin D supplements were ingested during the largest meal of the day; however, the content of these meals was not described [20].
Although baseline mean serum 25(OH)D level was low in all subjects and 5/30 subjects had serum 25(OH)D level < 25 nmol/L, serum PTH levels were within the normal range in all subjects. However, it is possible that at least part of the subjects had secondary hyperparathyroidism, as there was a negative correlation between serum PTH and 25(OH)D levels [21]. It is known that serum PTH levels increase with age, BMI, and low serum 25(OH)D levels [21,22]. This study was made in spring, when lower serum 25(OH)D levels are expected in this region [18].
Our study has limitations. The absorption of vitamin D was evaluated with only two meals with highly different fat content; however, these are not unusual dietary patterns in everyday life. Moreover, as the two meals were different also in other components, to offer a similar amount of calories, it cannot be excluded that vitamin D3 absorption was decreased in the low-fat meal group, due to its higher fiber content. Also, it cannot be excluded that different amounts of vitamin D were ingested by the subjects, as the amount of vitamin D in food was not evaluated. Nevertheless, it is very improbable that dietary vitamin D influenced the results, because natural food contains only small amounts of vitamin D. In addition, the participants were advised to keep their usual dietary patterns until completing the study. Another limitation was the measurement of serum 25(OH)D levels as a surrogate for serum vitamin D levels. Nonetheless, this metabolite increases rapidly after vitamin D supplementation, and it is measured to evaluate vitamin D status and the effect of vitamin D supplementation [17, 23].
As vitamin D absorption could explain in part the variability in serum 25(OH)D levels after the oral supplementation of this vitamin, other studies should be designed to clarify the role of food and dietary fat in vitamin D absorption, allowing us to determine the most effective way to improve vitamin D nutrition.
In conclusion, the results of this small randomized controlled trial show that vitamin D supplementation is more effective when given with fat-containing food.
These findings can have important implications to define the adequate dietary intake of vitamin D.
Conflict of Interests
The authors declare no conflict of interests.
Acknowledgments
The authors are grateful to the Division of Nutrition and Dietetics/Hospital de Clinicas de Porto Alegre for preparing and serving the meals used in the study and to Rosana Scalco for performing the measurements of 25(OH)D and PTH. they are also grateful to Fundo de Incentivo a Pesquisae Eventos (FIPE/HCPA), Coordenacao de Aperfeicoamento de Pessoal de Nivel Superior (CAPES), and Conselho Nacional de Desenvolvimento Cientifico e Tecnologico (CNPq) for providing fundings.
References
[1] A. W. Norman and R. Bouillon, "Vitamin D nutritional policy needs a vision for the future," Experimental Biology and Medicine, vol. 235, no. 9, pp. 1034-1045, 2010.
[2] A. Zittermann, J. F. Gummert, and J. Borgermann, "Vitamin D deficiency and mortality," Current Opinion in Clinical Nutrition and Metabolic Care, vol. 12, no. 6, pp. 634-639,2009.
[3] A. Mithal, D. A. Wahl, J. P. Bonjour et al., "Global vitamin D status and determinants of hypovitaminosis D," Osteoporosis International, vol. 20, no. 11, pp. 1807-1820, 2009.
[4] S. A. Stechschulte, R. S. Kirsner, and D. G. Federman, "Vitamin D: bone and beyond, rationale and recommendations for supplementation," The American Journal of Medicine, vol. 122, no. 9, pp. 793-802, 2009.
[5] S.S.Harris,B.Dawson-Hughes,andG.A.Perrone,"Plasma 25-hydroxyvitamin D responses of younger and older men to three weeks of supplementation with 1800 IU/day of vitamin D," Journal of the American College of Nutrition,vol. 18, no.5, pp. 470-474, 1999.
[6] S. S. Harris and B. Dawson-Hughes, "Plasma vitamin D and 25OHD responses of young and old men to supplementation with vitamin D3," Journal of the American College of Nutrition, vol. 21, no. 4, pp. 357-362, 2002.
[7] J. L. Johnson, V. V. Mistry, M. D. Vukovich, T. Hogie-Lorenzen, B. W. Hollis, and B. L. Specker, "Bioavailability of vitamin D from fortified process cheese and effects on vitamin D status in the elderly," Journal of Dairy Science, vol. 88, no. 7, pp. 22952301,2005.
[8] T. A. Outila, P. H. Mattila, V. I. Piironen, and C. J. E. Lamberg-Allardt, "Bioavailability of vitamin D from wild edible mushrooms (cantharellus tubaeformis) as measured with a human bioassay," American Journal of Clinical Nutrition, vol. 69, no. 1, pp. 95-98, 1999.
[9] V. Tangpricha, P. Koutkia, S. M. Rieke, T. C. Chen, A. A. Perez, and M. F. Holick, "Fortification of orange juice with vitamin D: a novel approach for enhancing vitamin D nutritional health," The American Journal of Clinical Nutrition, vol. 77, no. 6, pp. 1478-1483, 2003.
[10] R. M. Biancuzzo, A. Young, D. Bibuld et al., "Fortification of orange juice with vitamin D2 or vitamin D 3 is as effective as an oral supplement in maintaining vitamin D status in adults," The American Journal of Clinical Nutrition,vol. 91,no.6,pp. 1621-1626, 2010.
[11] I. M. G. Coelho, L. D. Andrade, L. Saldanha, E. T. Diniz, L. Griz, and F. Bandeira, "Bioavailability of vitamin D3 in non-oily capsules: the role of formulated compounds and implications for intermittent replacement," Arquivos Brasileiros de Endocrinologia e Metabologia, vol. 54, no. 2, pp. 239-243, 2010.
[12] K. Holvik, A.A. Madar,H.E. Meyer, C.M. Lofthus,and L. C. Stene, "A randomised comparison of increase in serum 25-hydroxyvitamin D concentration after 4 weeks of daily oral intake of 10 ,wg cholecalciferol from multivitamin tablets or fish oil capsules in healthy young adults," British Journal of Nutrition, vol. 98, no. 3, pp. 620-625, 2007.
[13] A. M. Natri, P. Salo, T. Vikstedt et al., "Bread fortified with cholecalciferol increases the serum 25-hydroxyvitamin D concentration in women as effectively as a cholecalciferol supplement," Journal of Nutrition, vol. 136, no. 1, pp. 123-127, 2006.
[14] D. Wagner, G. Sidhom, S. J. Whiting, D. Rousseau, and R. Vieth, "The bioavailability of vitamin D from fortified cheeses and supplements is equivalent in adults," Journal of Nutrition, vol. 138, no. 7, pp. 1365-1371, 2008.
[15] S. Astner and R. R. Anderson, "Skin phototypes 2003," Journal of Investigative Dermatology, vol. 122, no. 2, pp. 30-31, 2004.
[16] NEPA/UNICAMP NdEePeA, Tabela Brasileira de Composicao de Alimentos,Nui cleo de Estudos e Pesquisas em Alimentacao—NEPA, Universidade Estadual de Campinas—UNICAMP, Campinas, Brazil, 2nd edition, 2006.
[17] M. Ilahi, L. A. G. Armas, and R. P. Heaney, "Pharmacokinetics of a single, large dose of cholecalciferol," The American Journal Of Clinical Nutrition, vol. 87, no. 3, pp. 688-691, 2008.
[18] G. L. Saraiva, M. S. Cendoroglo, L. R. Ramos et al., "Influence of ultraviolet radiation on the production of 25 hydroxyvitamin D in the elderly population in the city of Sao Paulo (23°34'S), Brazil," Osteoporosis International, vol. 16, no. 12, pp. 1649-1654, 2005.
[19] J. Iqbal and M. M. Hussain, "Intestinal lipid absorption," American Journal of Physiology—Endocrinology and Metabolism, vol. 296, no. 6, pp. E1183-E1194, 2009.
[20] G. B. Mulligan and A. Licata, "Taking vitamin D with the largest meal improves absorption and results in higher serum levels of 25-hydroxyvitamin D," Journal o fBone and Mineral Research, vol. 25, no. 4, pp. 928-930, 2010.
[21] J. Pepe, E. Romagnoli, I. Nofroni et al., "Vitamin D status as the major factor determining the circulating levels of parathyroid hormone: a study in normal subjects," Osteoporosis International, vol. 16, no. 7, pp. 805-812, 2005.
[22] J. Aloia, T. Bojadzievski, E. Yusupov et al., "The relative influence of calcium intake and vitamin D status on serum parathyroid hormone and bone turnover biomarkers in a double-blind, placebo-controlled parallel group, longitudinal factorial design," Journal of Clinical Endocrinology and Metabolism, vol. 95, no. 7, pp. 3216-3224, 2010.
[23] E. Romagnoli, M. L. Mascia, C. Cipriani et al., "Short and long-term variations in serum calciotropic hormones after a single very large dose of ergocalciferol (vitamin D2) or cholecalciferol (vitamin D3) in the elderly," Journal of Clinical Endocrinology and Metabolism, vol. 93, no. 8, pp. 3015-3020, 2008.
See also VitaminDWiki
All items in Category How and When to take vitamin D 12 items Dec 2011
How you might double the benefit of your vitamin D
- co-factors, take vitamin D in evening, right form/kind of vitamin D, . . . .
Consuming more mono – not poly– unsaturated fat increased vitamin D – Aug 2011 type of fat matters as well
- Monosaturated Fats: (want to increase mono/poly ratio) = peanuts, olives, nuts, avocado, seeds, oils
Increased vitamin D in blood by 56% by taking supplement with largest meal of the day - May 2010