Vitamin D in US eggs: 2 to 18 IU
Cholesterol and vitamin D content of eggs in the U.S. retail market
Journal of Food Composition and Analysis, Volume 29, Issue 2, March 2013, Pages 110–116
Jacob Exler a,
Katherine M. Phillips b, Corresponding author contact information, kmpvpi@vt.edu
Kristine Y. Patterson a,
Joanne M. Holden a
a USDA Agricultural Research Service, Nutrient Data Laboratory, Building 005, BARC-West, 10300 Baltimore Avenue, Beltsville, MD 20705, USA
b Biochemistry Department, 304 Engel Hall (0308), Virginia Tech, Blacksburg, VA 24061, USA
Nationwide sampling in the U.S. of whole large eggs, to update values in the United States Department of Agriculture (USDA) National Nutrient Database for Standard Reference (SR) (http://www.ars.usda.gov/nutrientdata), was conducted in 2000–2001 and in 2010. Retail cartons of large eggs were obtained from 12 supermarket locations using statistical sampling plans based on market share and census data. Cholesterol was analyzed at three laboratories using standard methods involving gas chromatography of the saponified total lipid extract. Vitamin D3 and 25-OH-vitamin D3 (2010 samples only) were analyzed by HPLC and UHPLC–MS/MS. Quality control materials were included to validate the accuracy and precision of measurements. The mean cholesterol content decreased 51 mg/100 g (12%; p < 0.0001), from 423 mg/100 g in 2000–2001 to 372 (range 344–405) in 2010. Over the same period, average vitamin D3 increased by 60%, to 2.05 μg [80 IU]/100 g (range 0.97–12.1). Samples from 2010 contained 0.65 μg 25-OH-D3/100 g (range 0.43–1.32). The disparate vitamin D (and cholesterol) content of eggs sampled from different locations may reflect industry efforts to modify poultry feed or supplements to affect the nutrient profile of eggs. Cholesterol and vitamin D3 data from this work were included in SR release 23, and support food consumption surveys, food and nutrition policy, and consumer education.
Fig. 1. Sampling locations in 2000–2001 and 2010. AL = Alabama; AR = Arkansas; CA = California; CO = Colorado; CT = Connecticut; FL = Florida; IL = Illinois; IN = Indiana; MI = Michigan; MO = Missouri; NC = North Carolina; NY = New York; OK = Oklahoma; OR = Oregon; PA = Pennsylvania; TN = Tennessee; TX = Texas; WA = Washington.
Fig. 2. Cholesterol, vitamin D3 and total fat content of eggs sampled in the U.S. in 2000/2001 and 2010 (1 IU vitamin D3 = 0.025 μg).
Error bars indicate ±standard error.
Within each figure the 2000/2001 and 2010 means differ significantly only for cholesterol (p < 0.0001).
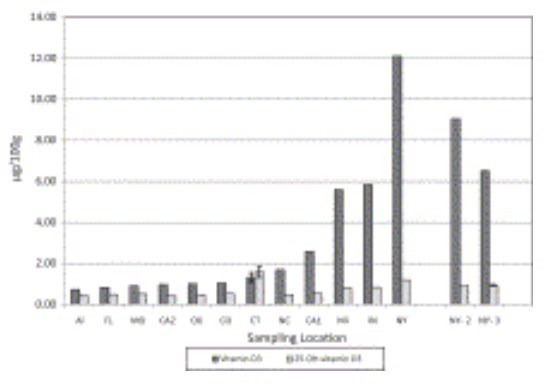
(Sorry about the fuzzy image - it was the best we could get for free)
Summary by VitaminDWiki
Assuming a yoke weighs 18 grams
|| | ugram/100 gram |IU/100 gram| IU/egg
Typical low|1|40|2 IU/egg
Typical high|8|320|18 IU/egg ||
Wonder – Do New York chickens get more sunlight or more vitamin D in their feed?
See also VitaminDWiki
- UVB on legs of chickens resulted in 70 IU vitamin D per egg yoke – July 2013
- Free range eggs=about 170 IU
See also web
- Vitamin D Fortification of Eggs for Human Health Journal of the Science of Food and Agriculture, Oct 2013
- Depending on the dietary concentrations used, it was possible to produce eggs with between 200–700 iu vitamin D