On-line Vitamin D response simulation
Personalise vitamin D 3 using physiologically based pharmacokinetic modelling
CPT Pharmacometrics Syst Pharmacol. 2021 May 7. doi: 10.1002/psp4.12640
Zhonghui Huang 1, Tao You 1
📄 Download the PDF from VitaminDWiki
Click here to run simulation
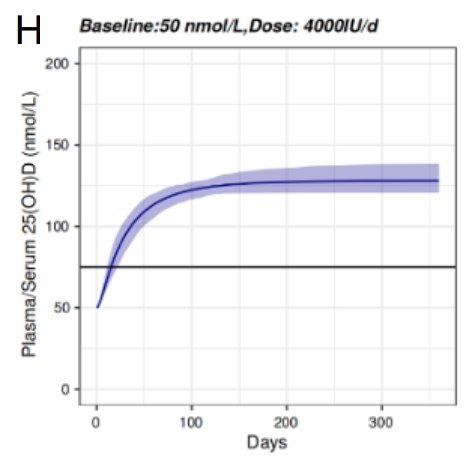
Model response for 20 ng 4,000 IU
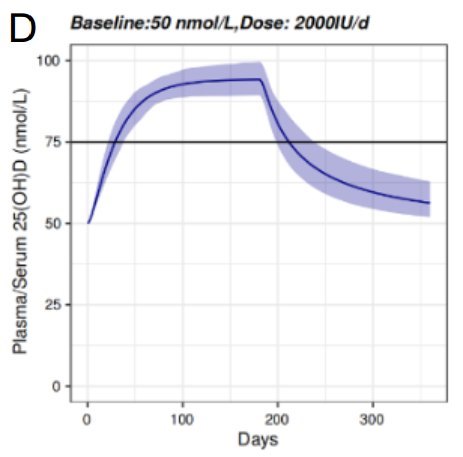
Model response for 20 ng 2,000 IU
Model 1.0

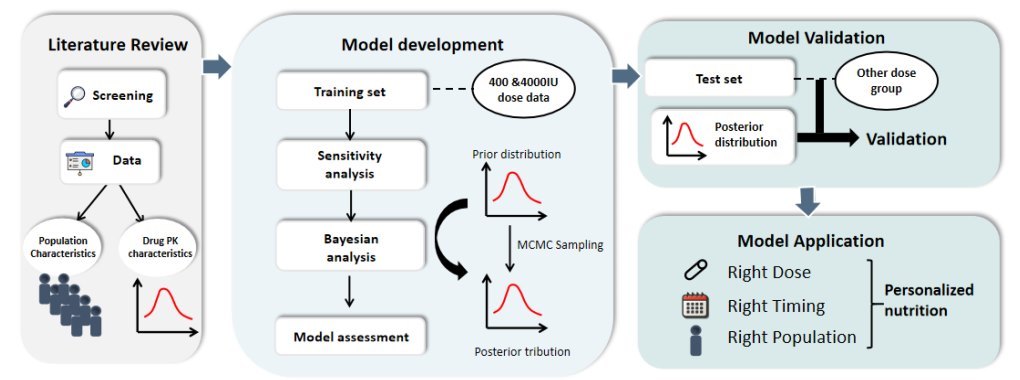
Model development
Observed data used to make the model
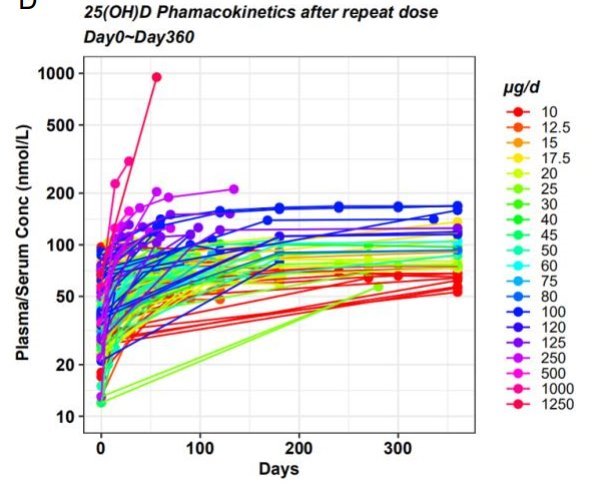
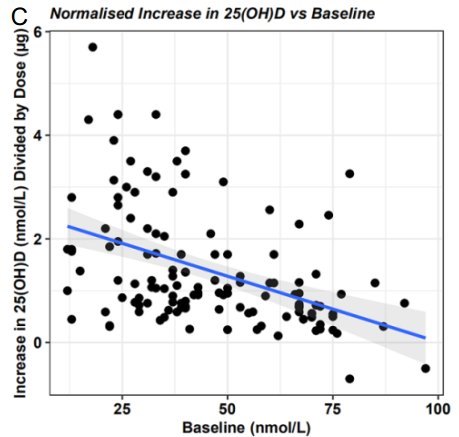
Observed Increases used to make the model
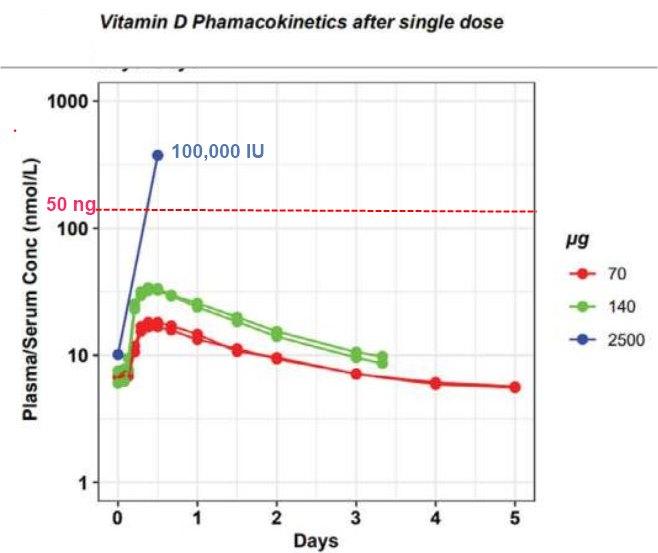
Observed single day dose-response
 not used in model?
 not used in model?
Plasma concentration of Vitamin D3 metabolite 25-hydroxyvitamin D3 (25(OH)D3 ) is variable among individuals. The objective of this study is to establish an accurate model for 25(OH)D3 pharmacokinetics (PK) to support selection of a suitable dose regimen for an individual. We collated Vitamin D3 and 25(OH)D3 plasma PK data from reported clinical trials and developed a physiologically based pharmacokinetic (PBPK) model to appropriately recapitulate training data. Model predictions were then qualified with 25(OH)D3 plasma PK under vitamin D3 and 25(OH)D3 dose regimens distinct from training data. From data exploration, we observed the increase in plasma 25(OH)D3 after repeated dosing was negatively correlated with 25(OH)D3 baseline levels.
Our final model included a first-order vitamin D3 absorption, a first-order vitamin D3 metabolism and a nonlinear 25(OH)D3 elimination function. This structure explained the apparent paradox.
Remarkably, the model accurately predicted plasma 25(OH)D3 following repeated dosing up to 1250μg/d in the test set. It also made sensible predictions for large single Vitamin D3 doses up to 50000μg in the test set.
Model predicts 10μg/d regimen may be ineffective for achieving sufficiency (plasma 25(OH)D3 ≥ 75nmol/L) for a severely deficient individual (baseline 25(OH)D3 = 10nmol/L), and it might take the same person over 200 days to reach sufficiency at 20μg/d dose. We propose to personalise vitamin D3 supplementation protocol with this PBPK model. It would require measuring 25(OH)D3 baseline levels, which is not routinely performed under the current UK public health advice.
Observed response charts from previous studies
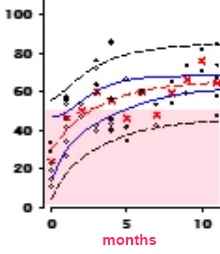
10,000 IU of Vitamin D for 7 years with no excessive Calcium in 4,800 patients – Dec 2018
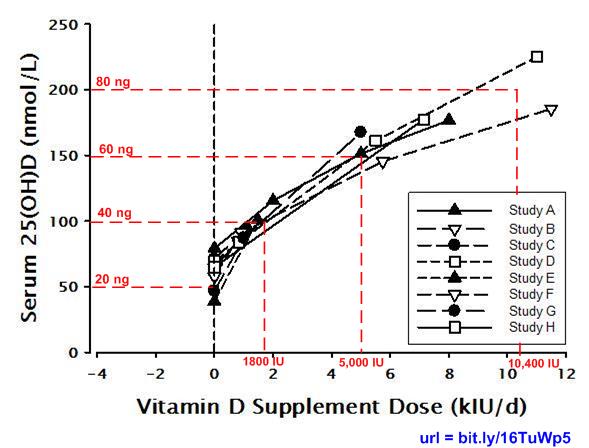
Response to Vitamin D: summary chart of 8 studies – March 2013
Same dose of vitamin D for everyone is virtually impossible - Dec 2015
Dose/response from 36 studies
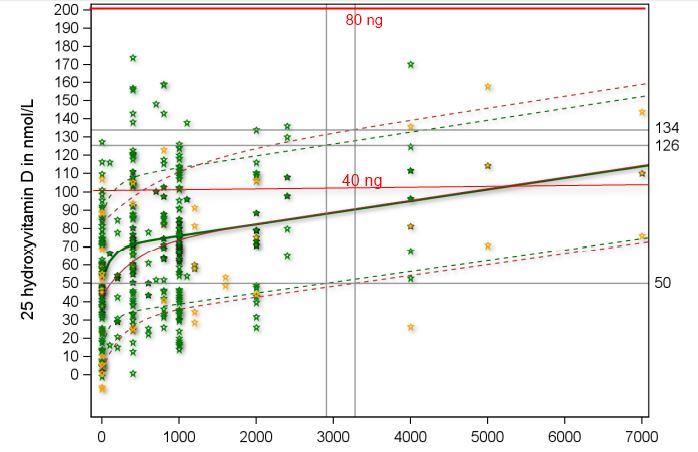
97% will have a response above the dashed lower line
Figure 2A daily dose of 3,200 IU
See also in VitaminDWiki
Response to Vitamin D varied by 12 ng due to gene variants (CYP2R1) – Aug 2019
10 reasons for poor response to Vitamin D (race, binding protein, etc.) – Nov 2017
24 ng lower response to Vitamin D due to obesity, low initial Vitamin D, and genetics – RCT Feb 2015
Some people need more vitamin D to get the same response – perhaps due to genes – Nov 2014
4700 IU of vitamin D needed by most seniors – an equation -July 2014
Predict Vitamin D category listing has items along with related searches
VitaminDWiki suggestions of possible refinements to version 1.0
Model 1.0 includes data from response by groups (not individuals) to daily dosing
Refinements that would likely decrease the response
weight,
obesity,
genes,
poor gut,
Poor liver, Poor kidney
Age (seniors have less bio-availability)
Refinements that might increase the response
other forms of vitamin D (topical, gut-friendly, etc)
co-factors (Mg, etc)
Other refinements of interest
other dosing intervals (weekly, 2 per month, monthly)
loading dose
loading dose followed by maintenance dosing
Click here to run simulation
Minimum that ce be simulated is daily for 1 week
Enter parameters then click on SiMULATE.
 Example
VitaminDWiki page titles containing "RESPONSE"
{LIST()}
Title change made Oct 2021 caused the visitor count to reset.
There have actually been visitors to this page since it was originally made