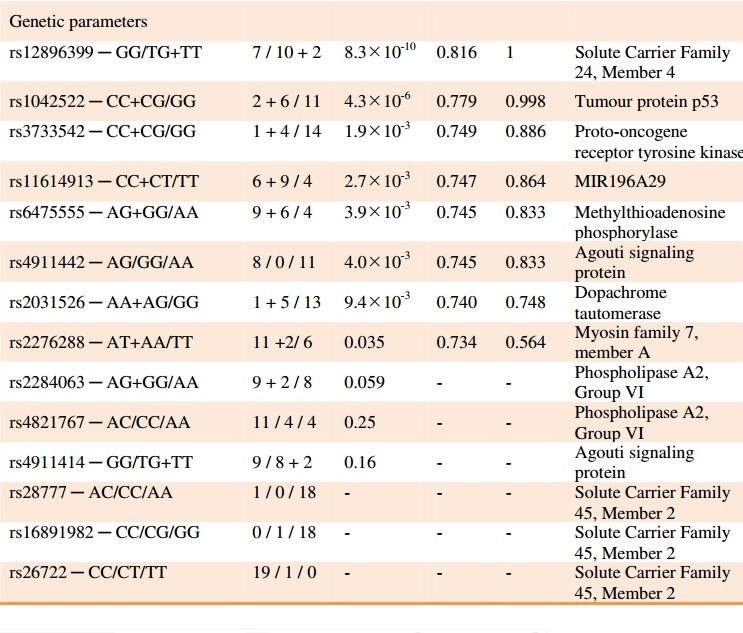
Poor responses to UV and Vitamin D were correlated to just 4 poor genes
Serum 25(OH)D levels after oral vitamin D3 supplementation and UVB exposure correlate.
Photodermatol Photoimmunol Photomed. 2019 Jun 5. doi: 10.1111/phpp.12491.
Datta P1, Philipsen PA1, Olsen P1, Andersen JD2, Morling N2, Wulf HC1.
📄 Download the PDF from Sci-Hub via VitaminDWiki
BACKGROUND: The inter-individual variation in 25(OH)D3 increase (Δ25(OH)D3 ) after vitamin D3 supplementation was determined and compared the UVB irradiation.
METHODS: Nineteen Danish participants received 85 μg vitamin D3 (cholecalciferol) daily for nine weeks with regular serum 25(OH)D3 measurements. These participants had three years earlier taken part in a 9-week controlled UVB study. The Δ25(OH)D3 was not confounded by ambient UVB, BMI or ethnicity.
RESULTS:
Δ25(OH)D3 was 53 nmol l-1 and almost identical to Δ25(OH)D3 (52 nmol l-1 ) after UVB. Δ25(OH)D3 ranged from 17 to 91 nmol l-1 (span 74 nmol l-1 ) and was about half of that observed after UVB irradiation (span 136 nmol l-1 ). The interquartile ranges for vitamin D3 supplementation (38.8-71.4 nmol l-1 , span: 32.6 nmol l-1 ) and UVB irradiation (35.7-65.4 nmol l-1 , span: 29.7 nmol l-1 ) were similar indicating a comparable response of the two interventions. As the 25(OH)D3 start levels (R2 = 0.398, P = 3.8 × 10⁻³ ), 25(OH)D3 end levels (R2 = 0.457, P = 1.5 × 10⁻³ ) and Δ25(OH)D3 (R2 = 0.253, P = 0.028) between both interventions were correlated, this suggested a possible common individual background for the variation. Four pigment SNPs influenced the variation in the vitamin D3 -induced and UVB-induced Δ25(OH)D3 . A combined model including the influence of these four SNPs and the 25(OH)D3 start level explained 86.8% (P = 1.6×10⁻³⁵ ) of the individual variation after vitamin D3 supplementation.
CONCLUSION: The inter-individual variation in the two interventions was comparable and had no common demographic but a partly common genetic background.