Comparing Preeclampsia and Gestational Hypertension
Gestational Hypertension vs. Preeclampsia
Claude AI - Aug 2026
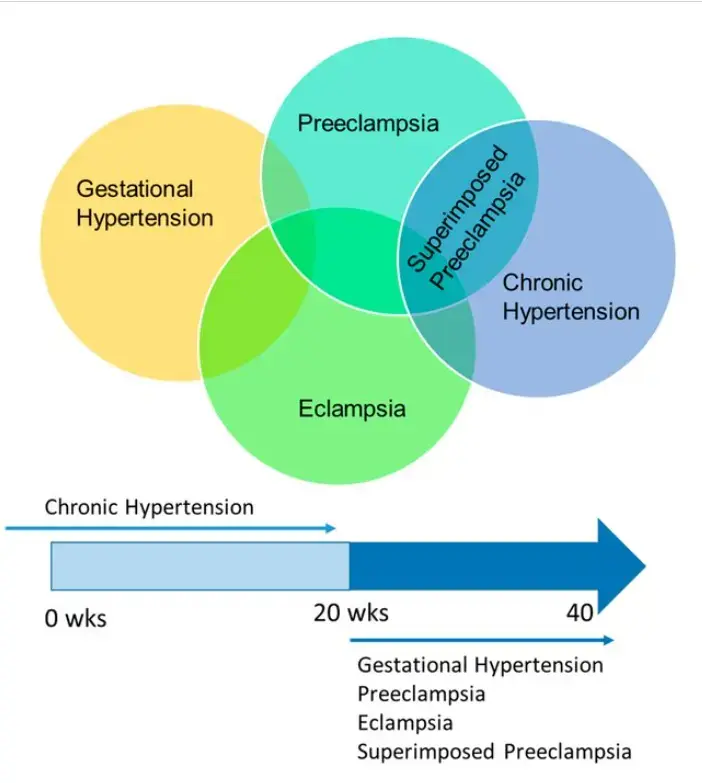
Both are hypertensive disorders of pregnancy (HDP), both are defined as new-onset after 20 weeks, and both are rising in the United States. They differ substantially in severity, cost, and consequences for the infant.
Side-by-side comparison
| Dimension | Gestational hypertension (GH) | Preeclampsia (PE) |
|---|---|---|
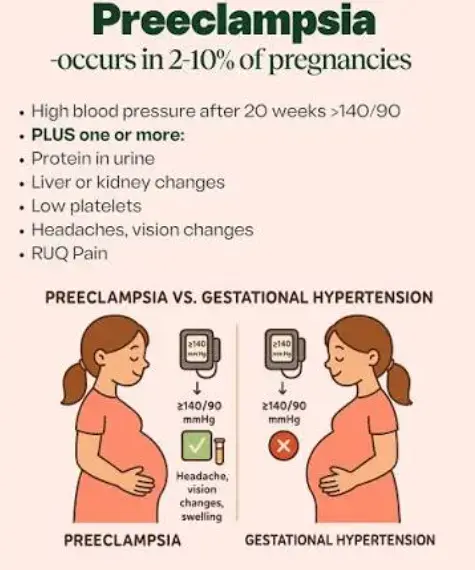
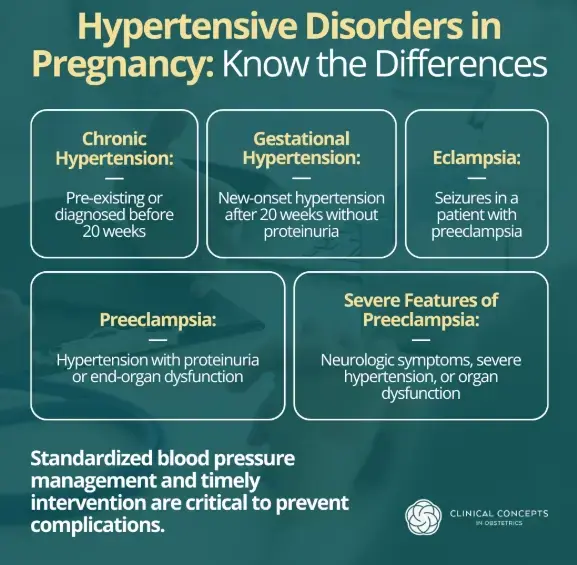
| Definition | BP ≥140/90 on two occasions ≥4 h apart, after 20 weeks; no proteinuria or end-organ involvement | Same BP threshold plus proteinuria or end-organ dysfunction (renal, hepatic, hematologic, neurologic) |
| US incidence | 10.4% of 2024 births (birth certificate, includes PE); ~2.6% by Medicaid clinical coding | ~4% to 8%, depending on source and definition |
| Recent trend | +73% from 2016 (6.0%) to 2024 (10.4%); 236,000 to 377,000 cases/yr | +25% from 1993 to 2014; roughly doubled since 2008 |
| Longer trend | Nearly tripled 1987–2004 (10.7 to 30.6 per 1,000). New-onset HDP overall nearly doubled 2007–2019, accelerating after 2014. | Included in the HDP trend above; early-onset PE growing faster than late-onset |
| Typical timing | Predominantly third trimester; mean ~33 weeks at diagnosis in cohort data | Bimodal: early-onset (<34 weeks, placental origin, more severe) and late-onset (≥34 weeks) |
| Median gestational age at delivery | 38.7–39.1 weeks | 36.5–37.1 weeks (normotensive reference: 39.5–39.6) |
| Cesarean rate | 36.7% | 52.5% (normotensive reference: 31.6%) |
| Maternal adverse events | 9.4% | 13.9% (normotensive reference: 3.5%–4.1%) |
| Infant adverse events | 4.8% | 14.6%–15.5% (normotensive reference: 0.7%) |
| Incremental cost per case | Reference tier for the PE comparison | +$17,600 to $20,300 above GH; +$28,600 to $30,600 above normal pregnancy. ~88% of the excess is infant cost. |
| Infant cost by gestational age | — | $183,883 at <28 weeks down to $5,587 at term |
| US national cost | Not separately estimated | $2.18 billion in the first 12 months post-delivery (2012): $1.03B maternal, $1.15B infant |
| Age with highest rate | 40 and older (113 per 1,000 in 2022); lowest at <20 and 30–34. J-shaped, not linear. | 40 and older; also elevated in the youngest mothers |
| Known infant problems | Preterm birth, low birthweight, fetal growth restriction, fetal and infant mortality; elevated offspring seizure risk | All of the above, more severe: low birthweight in 10%–20%, stillbirth risk 2–5×, higher neonatal mortality via prematurity, higher early-onset neonatal thrombocytopenia |
| Long-term maternal risk | Elevated risk of heart attack, heart failure, and stroke for decades afterward | Same, generally greater magnitude |
Progression from GH to preeclampsia
Roughly 10% to 50% of gestational hypertension cases progress to preeclampsia within 1 to 5 weeks. Both the probability of progression and the speed of it depend on how early the GH appears.
| Gestational age at GH presentation | Progressed to preeclampsia | Median time to progression |
|---|---|---|
| Before 32 weeks | ~40% | ~5 weeks |
| 32 to 35 weeks | 25% | ~2 weeks |
| All presentations (single cohort, n=240) | 17.1% | — |
Earlier onset means both a higher chance of progressing and a shorter window in which to intervene. This is the hinge on which cost and infant outcomes turn: the roughly $18,000–$20,000 gap between a GH case and a PE case is essentially the price of prematurity.
Why maternal age does not explain the rise
Maternal age has genuinely increased — the average age at first birth rose from 26.6 years in 2016 to 27.5 in 2023, first births to mothers 35 and older rose 25%, and advanced parental age went from 14.7% to 20.1% of births between 2010 and 2021. But two findings block the causal inference:
- Gestational hypertension rates rose within every age group and every BMI group. If a shift in the age composition of mothers were driving the increase, stratum-specific rates would be flat.
- The age gradient is J-shaped rather than monotonic. In 2022 the second-highest rate after the 35–39 band was 20–24 year olds (96 per 1,000), while 30–34 year olds had the lowest rate (92 per 1,000).
An additional confounder for any biological explanation: ACOG began calling for earlier identification of high blood pressure in pregnancy in 2018, and a task force recommended routine early-pregnancy blood pressure checks in 2023. Both fall inside the 2016–2024 window, and more looking finds more cases. The NCHS report itself states that the data show hypertension in pregnancy is increasing but not why.
Sources
- NCHS, National Vital Statistics Reports Vol. 75 No. 4 (July 29, 2026) — primary source for the 73% figure and 2024 rates
- JAHA: Trends in New-Onset Hypertensive Disorders of Pregnancy, Rural and Urban US, 2007–2019
- Trends in HDP Among the Medicaid Population Before and During COVID-19 — clinical-coding incidence
- Economic Burden of Preeclampsia: Maternal and Infant Healthcare Costs (Geisinger cohort)
- AJOG: Short-Term Costs of Preeclampsia to the US Health Care System
- JOGC: Gestational Hypertension and Preeclampsia — Are They the Same Disease?
- Gestational Hypertension and Progression Towards Preeclampsia (prospective cohort)
- Effects of Pregnancy-Induced Hypertension on Early-Onset Neonatal Thrombocytopenia
- Childstats.gov: Gestational Hypertension by Maternal Age and Race, 2016–2022
- JCI 2025: Gestational Hypertension Increases Risk of Seizures in Children and Mice
- CNN: definitional caveat on birth-certificate coding
Related in VitaminDwiki
- Vitamin D supplementation decreased the risk of preeclampsia by 39% – meta-analysis
- Risk of preeclampsia should drop to nearly zero at 60 ng of Vitamin D
- Preeclampsia reduced by Vitamin D - many studies
- Preeclampsia 2.7 X less likely if 50,000 IU of Vitamin D every 2 weeks – meta-analysis
- Child 49 percent higher risk of being overweight if preeclampsia during pregnancy
- No Preeclampsia during pregnancy if more than 60 ng of vitamin D – RCT
- Why preeclampsia is 5X more likely if vitamin D insufficient
A few web infographics