Vitamin D levels in Europe
Vitamin D: An overview of vitamin D status and intake in Europe
Nutrition Bulletin. Article first published online: 30 SEP 2014, DOI: 10.1111/nbu.12108
A. Spiro* and J. L. Buttriss

In recent years, there have been reports suggesting a high prevalence of low vitamin D intakes and vitamin D deficiency or inadequate vitamin D status in Europe. Coupled with growing concern about the health risks associated with low vitamin D status, this has resulted in increased interest in the topic of vitamin D from healthcare professionals, the media and the public. Adequate vitamin D status has a key role in skeletal health. Prevention of the well-described vitamin D deficiency disorders of rickets and osteomalacia are clearly important, but there may also be an implication of low vitamin D status in bone loss, muscle weakness and falls and fragility fractures in older people, and these are highly significant public health issues in terms of morbidity, quality of life and costs to health services in Europe.
Although there is no agreement on optimal plasma levels of vitamin D, it is apparent that blood 25-hydroxyvitamin D [25(OH)D] levels are often below recommended ranges for the general population and are particularly low in some subgroups of the population, such as those in institutions or who are housebound and non-Western immigrants. Reported estimates of vitamin D status within different European countries show large variation. However, comparison of studies across Europe is limited by their use of different methodologies. The prevalence of vitamin D deficiency [often defined as plasma 25(OH)D <25 nmol/l] may be more common in populations with a higher proportion of at-risk groups, and/or that have low consumption of foods rich in vitamin D (naturally rich or fortified) and low use of vitamin D supplements.
The definition of an adequate or optimal vitamin D status is key in determining recommendations for a vitamin D intake that will enable satisfactory status to be maintained all year round, including the winter months. In most European countries, there seems to be a shortfall in achieving current vitamin D recommendations. An exception is Finland, where dietary survey data indicate that recent national policies that include fortification and supplementation, coupled with a high habitual intake of oil-rich fish, have resulted in an increase in vitamin D intakes, but this may not be a suitable strategy for all European populations. The ongoing standardisation of measurements in vitamin D research will facilitate a stronger evidence base on which policies can be determined. These policies may include promotion of dietary recommendations, food fortification, vitamin D supplementation and judicious sun exposure, but should take into account national, cultural and dietary habits. For European nations with supplementation policies, it is important that relevant parties ensure satisfactory uptake of these particularly in the most vulnerable groups of the population.
📄 Download the PDF from VitaminDWiki.
Introduction
There has been a renewed interest in the nutrient vitamin D. In 1975 there were about 250 peer-reviewed papers published with the term ‘vitamin D’ in the paper title or its abstract but 30 years later, in 2007, this number had risen to around 1600 papers, and to 3774 in 2013.
In addition to its well-recognised role in musculoskeletal health, over the last decade evidence has suggested that low serum concentrations of 25-hydroxyvitamin D, 25(OH)D, are associated with a number of non-skeletal disorders including cancer, heart disease, high blood pressure, diabetes, age-related cognitive decline, Parkinson’s disease, multiple sclerosis and arthritis. However, whether low 25(OH)D is the cause or result of ill health is not yet clear (Autier et al. 2014).
The classic function of vitamin D is to regulate calcium absorption and homeostasis. It promotes calcium absorption from the gut, enables mineralisation of newly formed osteoid tissue in bone and plays an important role in muscle function (NOS 2013). It is well recognised that prolonged vitamin D deficiency is detrimental to the skeleton, resulting in rickets in children and osteomalacia in adults (Thacher & Clarke 2011). Serum 25(OH)D concentrations in these disorders range from the undetectable to around 20 nmol/l (DH 1998). Less severe vitamin D deficiency, sometimes termed vitamin D insufficiency, may lead to secondary hyperparathyroidism, bone loss, muscle weakness and falls and fragility fractures in older people (NOS 2013). Currently approved health claims for vitamin D under European nutrition and health claim regulations include contribution to the maintenance of normal bones and teeth, normal growth and development of bone in children, normal absorption/ utilisation of calcium and phosphorus, normal blood calcium concentrations and maintenance of normal muscle function (EFSA 2009; 2010; 2014).
Although there are some areas of debate in relation to vitamin D requirements and the impact of vitamin D intake and status on many aspects of human health, there is a general agreement that prevention of vitamin D deficiency is a public health priority. There is concern that low status appears to be prevalent in Europe, particularly in older institutionalised adults and in some ethnic groups (Mithal et al. 2009; Lanham-New et al. 2011).
The aim of this paper is to summarise the published data on vitamin D intake and the estimated prevalence of vitamin D deficiency, and to discuss approaches to improve vitamin D intake and status in the European population. Critically, it must be recognised that vitamin D deficiency can be prevented, and as such it has no place in Europe today.
Vitamin D and sun exposure
Vitamin D in the body may come both from dietary sources and from synthesis in the skin triggered by sun exposure, or more specifically ultraviolet B (UVB) irradiation. UVB irradiation stimulates cutaneous (skin) synthesis of cholecalciferol, which is stored in adipose tissue or undergoes hydroxylation in the liver to 25(OH)D, and then further hydroxylation in the kidney to the biologically active form, 1,25-dihydroxyvitamin D (IOM 2011; Vidailhet et al. 2012).
UVB sunlight exposure, rather than diet, has been reported as the main source for the majority of the population (Calvo et al. 2005). Several environmental factors, such as latitude and prevailing weather conditions, determine whether sunlight of sufficient strength is available to stimulate the conversion of 7- dehydrocholesterol in the skin to cholecalciferol. Synthesis of vitamin D varies during the year with peak levels of plasma 25(OH)D recorded following the summer months. In the northern hemisphere at latitudes greater than around 40°N (north of Madrid, see Table 1), sunlight is not strong enough to trigger synthesis of vitamin D in the skin from October to March. Therefore, substantial proportions of the European population rely on dietary vitamin D and body stores to maintain a healthy vitamin D status, particularly during the winter season (O’Connor & Benelam 2011).
However, in addition to European latitude, there may be further factors resulting in inadequate sun exposure.
Table 1 Latitudes of European cities
Lifestyle factors such as longer working hours indoors and less outdoor playtime for children may impact on achieving sufficient sun exposure. Furthermore, widespread public health advice on the association of sun exposure with skin cancer, as well as cosmetic concern about premature skin ageing, has increased the use of products with sun protection factor, which reduce cutaneous vitamin D production. This illustrates the challenge posed in balancing public health messages concerned with the risk of vitamin D deficiency associated with lack of skin exposure to sunlight, with advice about increased risk of skin cancer, resulting from excessive exposure to sunlight that causes sunburn (erythema). Cancer Research UK advises that individuals should stay below their personal sunburn threshold to minimise their skin cancer risk. This is supported by evidence that sufficient vitamin D generally can be produced in summer at UK latitudes by exposing the skin to sunlight for a few minutes only (minimising risk of erythema and cell damage) in the middle of the day, when the intensity of UVB is at its daily peak (Cancer Research UK 2010).
Another challenge is that there are few good natural dietary sources of vitamin D and there is increasing evidence that the dietary supply is often insufficient to offset the seasonal deficit in sunlight during the winter months. Consequently, consideration of policies regarding supplementation and fortification of foods with vitamin D, as well as encouraging sensible exposure to sunlight, are rising up the agenda in a number of countries.
Equivalence, abbreviations and synonyms
In the literature, vitamin D concentrations are expressed in different ways. Those most commonly used are listed in Table 2.
Vitamin D status in Europe
Overview
The main circulating form of vitamin D in plasma is 25(OH)D. It serves as an indicator of vitamin D status (Calvo etal. 2005; SACN 2007). It is also sometimes referred to as serum 25(OH)D, and these two terms are used interchangeably in this report, depending on usage in the reference from which the information was drawn.
Vitamin D status is derived from the combination of synthesis in the skin after sun exposure and intake of the two main dietary forms of vitamin D: ergocalciferol (vitamin D2) and cholecalciferol (vitamin D3) (Lanham- New et al. 2011). Personal characteristics, such as skin pigmentation, age, style of clothing, use of sunscreen, physical and outdoor activity and sun exposure behaviour, can prevent or promote vitamin D synthesis and will influence vitamin D status (Cashman & Kiely 2014). For example, melanin efficiently absorbs UVB photons and people with increased skin melanin pigmentation (darker skin) require longer exposures to sunlight to make the same amount of vitamin D compared with light-skinned people (Holick 2004). The importance of time spent outdoors was shown in a Swiss population study, where it was a significant predictor of low vitamin D levels in patients aged over 65 years (Mithal et al. 2009). Studies have shown an association between obesity and vitamin D deficiency, and it has been suggested that this may be due to vitamin D deposition in adipose tissue, resulting in lower circulating 25(OH)D levels in the blood (Kienreich et al. 2013).
Diet can also be an important determinant of vitamin D status, including consumption of natural vitamin D sources such as oil-rich fish, fortified foods and supplements, intake of which will be influenced by cultural dietary practices and national policies (IOM 2011; Lamberg-Allardt et al. 2013). Plasma 25(OH)D concentrations were lower in vegetarians and vegans than in meat and fish eaters in a UK study (Crowe et al. 2011), and the Hoorn Study in The Netherlands (van Dam et al. 2007) reported that determinants of vitamin D status were time spent outdoors, higher body mass index (BMI), the consumption of oil-rich fish and fortified fat spreads (fortified with 3 IU/g) and the use of vitamin D supplements.
The importance of such factors in the groups described as being at risk of vitamin D deficiency is highlighted in the literature and by some government health authorities (NICE 2013).
These groups include:
pregnant and breastfeeding women;
teenagers and young women;
infants and young children under 5 years of age;
older people aged 65 years and over;
people who have low or no exposure to the sun, e.g. those who cover their skin for cultural reason or who are housebound or confined indoors for long periods;
people who have darker skin, e.g. people of African, African-Caribbean and South Asian origin and living in Europe, because their bodies are not able to make as much vitamin D for the reasons described above.
Not all European health bodies classify the same population groups as at risk, although infants, institutionalised elderly people and Asian/African immigrant populations are frequently mentioned.
Definitions of adequate and optimal vitamin D status
Globally, there is a general consensus that blood 25(OH)D levels below 25 nmol/l (or 10 ng/ml) qualify as ‘deficient’, but beyond this there is currently no standard definition or agreement as to ‘optimal’ 25(OH)D levels (SACN 2007; Cancer Research UK 2010). The lack of consensus and definitions between countries has given rise to a range of terminology and associated values in the literature to describe vitamin D status, including the terms ‘deficiency’, ‘insufficiency’, ‘adequacy’ and ‘optimal’. Inconsistency in the cut-off levels used alongside the interchangeable use of terminology makes accurate comparisons of reported prevalence difficult (Thacher & Clarke 2011; Hilger et al. 2014).
A blood 25(OH)D concentration below 25 nmol/l is considered the lower threshold of vitamin D status and/or an indicator of risk of vitamin D deficiency. This cut-off value was set with regard to prevention of rickets and/or symptomatic osteomalacia. It has been used for defining the lower limit of adequacy of vitamin D status in the UK (DH 1998), such that concentrations below 25 nmol/l should be achieved throughout the year by 97.5% of the population to protect against poor bone health.
The US Institute of Medicine (IOM) recommendations for vitamin D (IOM 2011), based on a review of the evidence, concluded that:
serum 25(OH)D <30 nmol/l is deficient;
serum 25(OH)D of 30-50 nmol/l may be ‘inadequate’ in some people;
serum 25(OH)D >50 nmol/l is ‘sufficient’ for almost the whole population (97.5%).
The UK National Osteoporosis Society (NOS 2013) recently proposed that IOM vitamin thresholds should be adopted by UK practitioners.
Although IOM suggests a 25(OH)D level above 50 nmol/l as a measure of ‘sufficiency’, a concentration of <50 nmol/l would not necessarily be considered diagnostic of vitamin D deficiency, nor necessarily a threshold for intervention with supplementation. The World Health Organization (WHO) and the review undertaken to inform the new Nordic Nutrition Recommendations, NNR 2012, (Nordic Council of Ministers 2014) have also defined vitamin D ‘insufficiency’ as a serum 25(OH)D below 50 nmol/l (WHO Scientific Group on the Prevention and Management of Osteoporosis 2003; Lamberg-Allardt et al. 2013), with serum 25(OH)D below 25 nmol/l considered to indicate ‘deficiency’. In the critical review underlying the recommendations for DACH countries (Germany, Austria and Switzerland) (German Nutrition Society 2012), the authors established a serum 25(OH)D concentration higher than 50 nmol/l as an indicator of optimal status. In 2000, dietary reference values (DRVs) for vitamin D in The Netherlands were established on the basis of a target of at least 30 nmol/l for serum 25(OH)D level all year round (Health Council of the Netherlands 2000). This is derived from the level at which the risk of rickets in children is minimal. In a more recent report, the expert committee for the Health Council set a higher target figure of at least 50 nmol/l for women aged 50 and over, and for men aged 70 and over (Health Council of the Netherlands 2012), based on evidence of the effect of vitamin D supplementation on bone quality in the elderly (Weggemans et al. 2009).
Most typically, vitamin D deficiency is marked by a threshold of less than 25-30 nmol/l and insufficiency by concentrations in the range 25-49 nmol/l, although some have advocated higher sufficiency thresholds. The Endocrine Society Task Force (Holick et al. 2011), for example, dispute IOM recommendations and recently published a clinical practice guideline that defined vitamin D deficiency as a serum 25(OH)D <50 nmol/l, and advocate that 25(OH)D concentration should exceed 75 nmol/l to maximise the effect of vitamin D on calcium, bone and muscle metabolism. These recommendations were echoed in the consensus for optimal serum 25(OH)D concentrations from Central Europe, including Poland, Hungary, Belarus, Estonia, Czech Republic and Ukraine (Pludowski et al. 2013), with a proposed range from 75-125 nmol/l. However, IOM has emphasised the uncertainty about the strength of evidence to support the need to aim for substantially higher serum 25(OH)D concentrations of >75 nmol/l, and others suggest that these proposals (75-125 nmol/l) are somewhat premature (Bouillon et al. 2013) as the evidence for functional outcomes associated with these higher levels is currently unclear.
Limitations in comparisons of vitamin D status
Comparisons of the prevalence of vitamin D deficiency are considerably hampered by a lack of consensus about its definition, resulting in a variety of cut-off points being used in European population studies (Hilger et al. 2014). Additional important limitations when comparing studies relate to differences in study design, choice of vitamin D assay methodology and the season or months in which blood samples were taken, geographic latitude of the population under study, and the age range, ethnicity and sex of the study populations (Wahl et al. 2012; Hilger et al. 2014).
The consistency of laboratory measurements is improving with standardisation and strict guidelines now in place in some research centres, but data collected outside of such guidelines may be unreliable and should be interpreted with caution. Recent improvements in standardisation include use of the gold standard reference vitamin D method, liquid chromatography-mass spectrometry, used for example by the US Centers for Disease Control and Prevention (CDC) and the UK National Laboratory for analysis of vitamin D for health and nutrition surveys (Arneson & Arneson 2013). Furthermore, the US National Institutes of Health established the Vitamin D Standardization Program (VDSP) in November 2010 to standardise the laboratory measurement of vitamin D status worldwide. VDSP is a collaborative effort with CDC, the National Institute of Standards and Technology, the Laboratory for Analytical Chemistry of Ghent University, Belgium, and the Vitamin D External Quality Assessment Scheme. Key VDSP participants include the national health surveys from Australia, Canada, Germany, Ireland, Mexico, South Korea, the UK and the US. Standardisation of methodology is essential to determine reliable thresholds for deficiency and insufficiency and hence to identify poor vitamin D status effectively.
Vitamin D status and prevalence of insufficiency
Estimates of vitamin D status within different European countries (Table 3) show large variation. Vitamin D deficiency [serum 25(OH)D <25 nmol/l] has been reported in 2-30% of European adults, increasing in the institutionalised elderly to 80% in some studies (Lips 2007). It should be stressed that vitamin D deficiency is easily treatable, so high prevalence of vitamin D deficiency is unacceptable in Europe. In the sections that follow, the limitations of non-standardised methodology used in studies should be recognised.
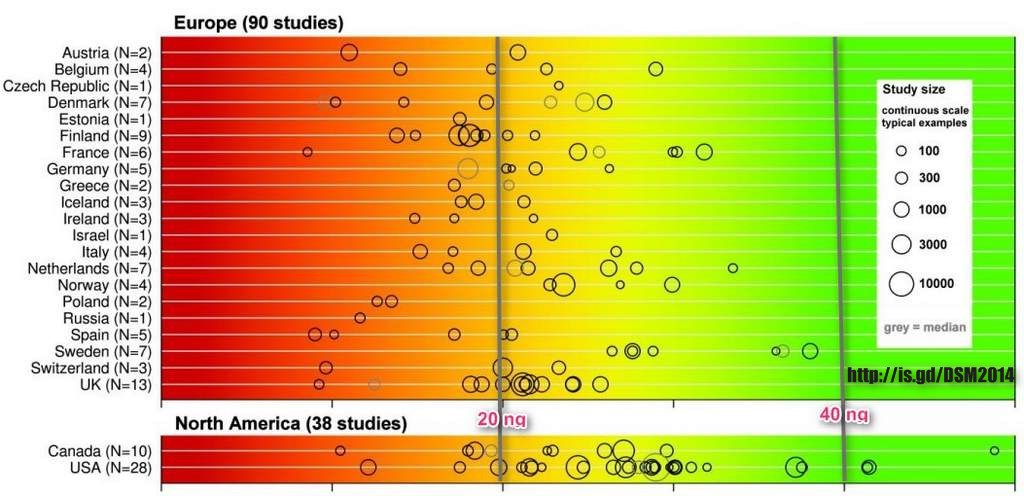
Mean vitamin status in Europe
The International Osteoporosis Foundation and DSM Nutritional Products (DSM) have recently developed a worldwide map to provide a global representation of vitamin D status. The map is based on a systematic review of worldwide literature published between 1990 and 2011 (Wahl et al. 2012; Hilger et al. 2014), which identified 200 studies from 46 countries that assessed circulating 25(OH)D in samples of randomly selected children and adults, either from the general population or from specific age groups within it. The categories used for vitamin D status were >75 nmol/l (‘desirable’), 50-74 nmol/l (‘inadequate’), 25-49 nmol/l (‘insufficient’) and <25 nmol/l (‘deficient’). One of the key findings was of significantly higher values in North America than in Europe, a finding that the authors suggested could be explained by the routine fortification of several foods in the US (e.g. milk).
Studies and reviews (Mithal et al. 2009; Van Schoor & Lips 2011) often report a north-south gradient in Europe, with Scandinavian countries generally showing higher values for circulating 25(OH)D than in Southern Europe. The somewhat unexpected north-south gradient, with a positive correlation between vitamin D status and latitude may be influenced by diets containing more oil-rich fish, a higher use of cod liver oil and other vitamin D supplementation, and population differences in skin pigmentation (Mithal et al. 2009). For example, the significance of supplement use, including cod liver oil, was reflected in vitamin D status in Iceland, with serum 25(OH)D concentrations averaging <28 nmol/l in February to March in adult men and women not taking supplements, compared with 48 nmol/l for those taking cod liver oil or other vitamin D-containing supplements (Lamberg-Allardt et al. 2013).
Table 3 Vitamin D status reported in children and adults in Europe
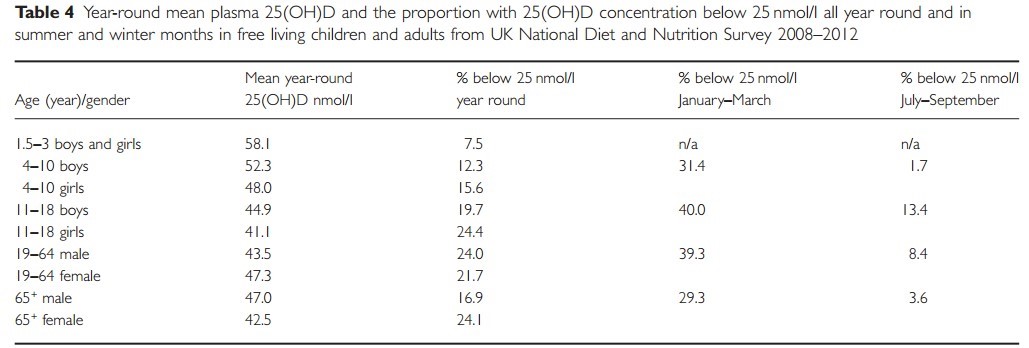
Table 4 Year-round mean plasma 25(OH)D and the proportion with 25(OH)D concentration below 25 nmol/l all year round and in summer and winter months in free living children and adults from UK National Diet and Nutrition Survey 2008-2012
Interestingly, the north-south European gradient was not confirmed in the latest review (Hilger et al. 2014), although higher values were observed among elderly people in Sweden compared with elderly people from other European countries.
Within countries, the variation in vitamin D status can also be high. The Supplementation en Vitamins et Mineraux Antioxydants (SUVIMAX) study in French men and women aged 35-65 years showed a mean serum 25(OH)Dof43 nmol/l in Northern France and 94 nmol/l in the southwest of France (Chapuy et al. 1997). In this study, the correlation between serum 25(OH)D and latitude was inverse as expected, probably reflecting the importance of sunlight exposure in populations with similar national dietary and supplement patterns.
A literature review of studies of healthy populations in Central Europe (Pludowski et al. 2014) reported a mean wintertime 25(OH)D concentration range from around 28 nmol/l in Poland to 45 nmol/l in Estonia. Summertime 25(OH)D concentrations ranged from 45 nmol/l in Ukraine to around 88 nmol/l in Hungary, and annual average values specifically in larger studies (n > 100) ranged from 35 mmol/l in Ukraine to 72 nmol/l in Belarus. The authors also reported mean serum concentration of vitamin D in Central Europe to be similar to Western European countries of comparable latitude; wintertime values ranged from 33 nmol/l in Denmark to 50 nmol/l in Austria, whereas those in summertime ranged from 58-87 nmol/l.
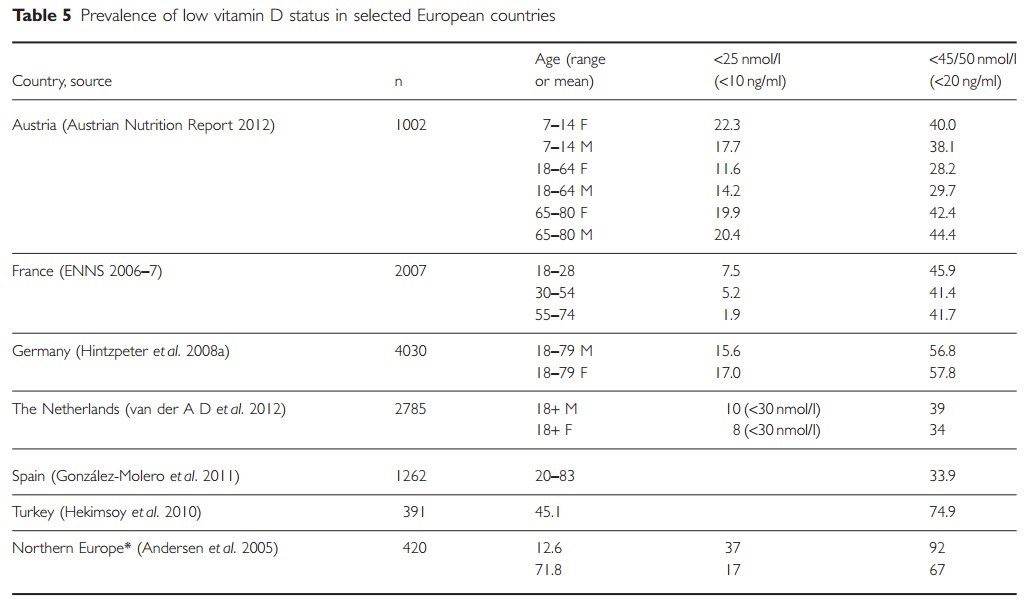
Although general population means give a crude snapshot estimate of the vitamin D status of European populations, they are not informative about the proportion of the population that is vitamin D deficient or the prevalence of low vitamin D status in vulnerable groups, and may not reflect important seasonal variations (see Tables 4 and 5).
An analysis of the UK National Diet and Nutrition Survey for the period 2008/2009-2011/2012 (see Table 4) reported, as expected, highest mean 25(OH)D concentrations in those providing a blood sample during July to September and lowest during January to March (Bates et al. 2014). Marked seasonal variations were also reported in an evaluation of the vitamin D status of 6146 Danish adults (Thuesen et al. 2012). Prevalence of vitamin D deficiency, defined as 25(OH)D <25 nmol/l, was 13.8% and insufficiency [25(OH)D <50 nmol/l] was 52.2%, with median concentrations lowest in February and highest in August. Seasonal variation was reported in Germany; 9.8% of men aged 18-79 years had a 25(OH)D level below 25 nmol/l in summer and in winter this rose to 21.4%. Similarly in The Netherlands, in adult females the proportion with vitamin D status below 25 nmol/l in summer was 3%, but this rose to 14% in winter.
As illustrated in Table 5, the cut-off point used to define deficiency will influence the proportion of the population reported as deficient or with low status.
Prevalence of deficiency in European population subgroups
Some of the concern over low vitamin D status has been provoked by reports of the re-emergence of rickets in Europe (Hypponen & Power 2007). In the 19th and early 20th centuries, the prevalence of rickets in children in industrialised Europe and North America was high. Recognition of the role of UVB light in the synthesis of vitamin D, implementation of measures to control atmospheric pollution, fortification of a variety of foods including margarine and widespread use of cod liver oil eradicated rickets as a significant health problem by the late 1930s (Holick 2010). In the 1950s, however, excessive intakes of vitamin D were suggested as a causative factor for cases of failure to thrive and hypercalcaemia, described among infants and young children in the UK, although robust evidence supporting this association is not available (SACN 2007). Consequently, enthusiasm for fortification waned in the UK and the rest of Europe, and vitamin D levels in cod liver oil supplements and infant milks and cereals were reduced.
From the 1960s onwards, in the UK and other European countries, rickets began to re-emerge as a health problem among toddlers and adolescents of immigrants from South Asia and the West Indies. In response, a UK Working Party recommended continued mandatory fortification of margarine, and an appropriate supplementation programme was introduced that formed a pillar of the Department of Health (DH)’s ‘Stop Rickets Campaign’, launched in 1981, which targeted British Asians (Mughal 2012).
Over the last 15 years there have again been several isolated reports of the re-emergence of florid rickets. A 2002 survey of paediatricians in the West Midlands region of the UK identified 24 cases of symptomatic vitamin D deficiency in children less than 5 years of age, and reported an incidence of rickets of 38, 95 and 0.4 per 100 000 per annum in South Asian, Black and White children aged 0-5 years, respectively (Callaghan et al. 2006). Between 2002 and 2008, 160 cases of symptomatic vitamin D deficiency were identified in a children’s hospital in Scotland; 40% presented with bowed legs and 19% with fits. Three cases of rickets were recorded in children of European descent whereas the rest were in children of South Asian, Middle Eastern or sub-Saharan African background (Ahmed et al.
. In an accompanying editorial in Archives of Disease in Childhood, the authors (Davies & Shaw 2011) commented that strategies targeting vitamin D supplementation, in particular those directed to children and their mothers in certain vulnerable ethnic groups, may be inadequate.
A study looking at nutritional and hereditary rickets in Southern Denmark (Beck-Nielsen et al. 2009) reported that the overall incidence of nutritional rickets in all children aged 0-15 years between 1995 and 2005 was 2.9 per 100 000, higher than the incidence in the preceding 10 years (1.7 per 100 000). However, the average incidence reported for immigrant children born in Denmark, specifically, was 60 per 100 000. Following the launch of vitamin D supplementation recommendations in 1995, the incidence in children aged 0-2.9 years of ethnic Danish origin decreased (5.0 per 100 000, 1985-1994 to 2.0 per 100 000, 1995-2005). In contrast, incidence in immigrant children born in Denmark during 1995-2005 was 100 per 100 000. The authors concluded that supplement uptake among the immigrant population may be low and fortification, taking ethnic variations of the diet into account, may be a possible alternative approach.
In Eastern Turkey, the incidence of rickets declined (from 6.09% in 1998 to <0.1% in 2008) after a free nationwide supplementation programme was initiated in 2005 (Ozkan et al. 2009). This suggests that free and widely distributed provision may be an effective way of preventing rickets, where rickets is prevalent and compliance with general supplementation advice is poor (Hatun et al. 2011). However, infants with low vitamin D status still remained, suggesting the campaign was ineffective at reaching certain families.
An increasing number of studies suggest that vitamin D deficiency during pregnancy is associated with adverse health outcomes in mothers, neonates and children (Vandevijvere et al. 2012; Dawodu & Akinbi 2013). Infants of vitamin D-deficient mothers are at high risk of vitamin D deficiency, and will be at even higher risk if they are fed on breast milk for a prolonged period and not given vitamin D supplements (Shaw & Mughal 2013). Furthermore, exclusively breastfed infants of mothers who are vitamin D deficient are more likely to be deficient than formula-fed infants because formula feeds are vitamin D fortified (NICE 2007; EFSA 2012).
Migrant populations
Studies show that the vitamin D status of immigrant populations and asylum seekers in Europe is poor compared with the indigenous European populations (Van der Meer et al. 2011). In a survey of German children aged 1-17 years, median 25(OH)D concentration was 44 nmol/l among indigenous German children and 35 nmol/l among immigrant children (Hintzpeter et al. 2008b). Serum 25(OH)D was below 25 nmol/l in up to 80% of non-Western immigrants in The Netherlands, with particularly high prevalence in women (Wicherts et al. 2011). For instance in 613 Dutch adults aged 18-65 years, the prevalence [95% confidence interval (CI)] of vitamin D deficiency [serum 25(OH)D <25 nmol/l] was higher in Turkish (41.3%; 32.5-50.1), Moroccan (36.5%; 26.9-46.1), Surinam South Asian (51.4%; 41.9-60.9), Surinam Creole (45.3%; 34.0-56.6) and sub-Saharan African (19.3%; 9.1-29.5) compared with the indigenous Dutch (5.9%; 1.3-10.5) (Van der Meer et al. 2008). In a Danish study in immigrant children and adults of Pakistani origin, 81% of girls, 84% of women and 65% of men had 25(OH)D concentrations below 25 nmol/l and 46% of girls, 40% of women and 13% men had concentrations below 10 nmol/l (Andersen et al. 2008).
Pregnant non-Western women may also be at particularly high risk of deficiency; a study in midwife practices in The Hague showed serum 25(OH)D levels lower than 25 nmol/l in more than 80% of Turkish and Moroccan immigrants (Van der Meer et al. 2006). A UK study reported that serum 25(OH)D levels <25 nmol/l were highly prevalent in South Asian women of child-bearing age in the winter (81%) and autumn (79.2%). The authors commented that in light of adverse effects of vitamin D deficiency in pregnancy, the health risks were serious (Darling et al. 2013).
Adolescents
There have been several reports, using different cut-off values, detailing the prevalence and risk factors for low vitamin D status in European adolescents, with regional and seasonal differences. As part of the OPTImal FORification of vitamin D (OPTIFORD) study (Andersen et al. 2005; Tylavsky et al. 2006), 25(OH)D levels were measured between February and March in adolescent girls (mean age 12.5 years) from four Northern European countries: Denmark, Finland, Poland and Ireland (latitudes between 51° and 60°N). The prevalence of vitamin D deficiency (defined as <25 nmol/l) ranged from 26 to 51%, while over 90% of the adolescents had suboptimal 25(OH)D levels (<50 nmol/l). High winter prevalence of deficiency has also been reported in Southern Europe. For example, 47% of Greek adolescents were found to have serum 25(OH)D <25 nmol/l (Lapatsanis et al. 2005).
In the Healthy Lifestyle in Europe by Nutrition in Adolescence (HELENA) study in nine European countries (Valtuena et al. 2013), around 80% of the sample of 1006 adolescents aged 12.5-17.5 years were categorised as having suboptimal levels, where sufficiency was classified as >75 nmol/l; 39% had levels of 50-75 nmol/l, 27% were classified as deficient (27.5-49.99 nmol/l) and 15% as severely deficient (<27.5 nmol/l). Adolescent males seem to have both higher 25(OH)D levels and higher vitamin D intakes than female adolescents.
Older adults
In general, older adults are at an increased risk of vitamin D deficiency, not only due to reduced skin production of vitamin D with age but also because of age- related factors that can result in limited sun exposure, such as being more housebound (NICE 2013).
The Survey in Europe on Nutrition and the Elderly, a Concerted Action (SENECA) study of older people living independently reported higher mean serum 25(OH)D levels in men than in women; 36% of older men and 47% of older women had 25(OH)D serum concentrations below 30 nmol/l (Van der Wielen et al. 1995). The Longitudinal Ageing Study Amsterdam (LASA), in community-living older people aged over 65, reported a serum 25(OH)D lower than 25 nmol/l in 8% of men and 14% of women, and lower than 50 nmol/l in 45% of men and 56% of women (Snijder et al. 2005).
The prevalence of deficiency is of particular concern in housebound or institutionalised older people. For example, a study in Swiss nursing homes showed 90% of women had levels below 50 nmol/l compared with 57% in non-institutionalised women (Krieg et al. 1998). A recent Swedish study in 11 nursing homes reported that 80% had 25(OH)D levels below 50 nmol/l, and vitamin D deficiency was associated with increased mortality (Samefors et al. 2014).
Vitamin D status in post-menopausal women is of interest because of the association of low vitamin D status with increased risk of osteoporosis and fracture. Assessment of 25(OH)D in 8532 post-menopausal women with osteoporosis or osteopenia in several European countries (France, Belgium, Denmark, Italy, Poland, Hungary, the UK, Spain and Germany) indicated that mean 25(OH)D was 61.0 nmol/l (Bruyere et al. 2007), with the overall prevalence of 25(OH)D inadequacy (<50 nmol/l) reported as 32.1%. There was, however, a highly significant difference across European countries (P < 0.0001). The lowest level of 25(OH)D was found in France 51.5 [standard deviation (SD) 26.1] nmol/l} and the highest in Spain [85.2 (SD 33.3) nmol/l]. In a study population of 700 Italian osteoporotic women aged 60-80 years, values of 25(OH)D lower than nmol/l were found in 27% of the women and lower than 30 nmol/l in 76% (Isaia et al. 2003).
Vitamin D recommendations in Europe
Currently, most countries in Europe establish their own nutrient recommendations (Doets et al. 2008), including a recommendation that would be expected to deliver adequate serum 25(OH)D status in most subjects (97.5% of the population). Such recommendations are typically based on ensuring adequate serum levels to support skeletal health and do not consider the prevention of risk of other health conditions such as cancer, diabetes and autoimmune diseases, where the function of vitamin D has yet to be been sufficiently demonstrated (IOM 2011; Health Council of the Netherlands 2012). Nevertheless vitamin D recommendations vary from country to country.
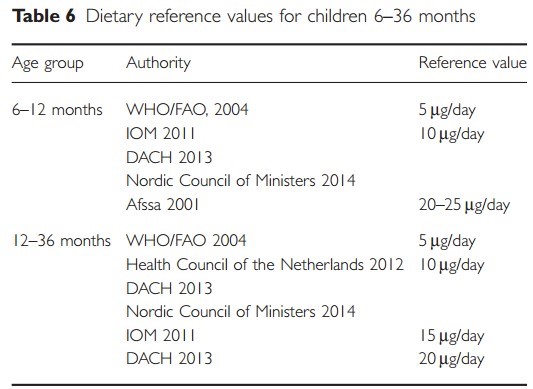
DRVs for infants and young children in the European Union (EU) were published by the European Food Safety Authority (EFSA) in 2013. The panel concluded that 10 Fg/day is adequate for infants and children aged 0-36 months who have minimal sun exposure (EFSA 2012) because clinical deficiencies in infants aged 0-6 months receiving vitamin D at doses of 10 Fg/day have not been observed, and an intake of 10 Fg/day generally appears to maintain serum 25(OH)D concentrations above 50 nmol/l throughout infancy (Braegger et al. 2013). For 6-36 months, the Scientific Committee of Food of the European Commission (EC) had previously set an adequate intake for vitamin D of 10 Fg/day. The level of 10 Fg lies within the range of more recent reference values for this age group from other scientific or authoritative bodies (Table 6).
The majority of European countries increase the reference values for older adults to account for the reduced capacity of the skin to produce vitamin D with ageing. Furthermore, some European health bodies recommend that ‘at risk’ groups with insufficient exposure to sunlight may require a vitamin D supplement to ensure adequate 25(OH)D concentration.
Table 6 Dietary reference values for children 6-36 months
Some of the differences in reference values (see Table 7) reflect a notable trend for vitamin D reference intakes to be increased following publication of IOM’s report (IOM 2011), assuming no or minimum sun exposure, as has occurred for DACH (German Nutrition Society 2012) and the Nordic countries (Nordic Council of Ministers 2014). Dietary recommendations of 10-15 pg/day have been suggested as sufficient to maintain blood serum levels of above 25 nmol/l, but this may not be adequate to keep the majority of the population above the higher value of 50 nmol/l in winter without adequate sun exposure in the summer season (Cashman et al. 2008).
Dietary sources
Dietary sources of vitamin D are limited. Natural sources most notably are oil-rich fish and eggs, although small amounts provided by meat can be important in some countries (Table 8). Further sources of dietary vitamin D are fortified foods (most often milk and dairy products, margarine and spreads and some breakfast cereals). Both cholecalciferol (D3) and ergocalciferol (D2) are used in fortification and as dietary supplements.
Table 8 UK nutrient analysis: vitamin D content of various foods
Vitamin D2 is obtained from plant sources (fungi and yeast) whereas vitamin D3 is traditionally obtained from animal sources (Japelt & Jakobsen 2013), typically lanolin (sheep’s wool) but can now also be extracted from lichens making it suitable for vegans (The Vegan Society 2014).
Research funded by the UK Food Standards Agency (Ashwell et al. 2010) suggests that the typical daily intake of vitamin D from food contributes less than UVB sunlight exposure to average year-round 25(OH)D levels. Holick (2004) has suggested that 90% of vitamin D requirements come from exposure to sunlight, but a report of the International Agency for Research on Cancer Working Group on Vitamin D (WHO/IARC 2007)concluded that statistical models do not support this statement, and in many populations the exogenous sources of vitamin D found in diets and supplements are far from negligible, especially in the winter. Thus, although sunlight is clearly an important contributor to adequate vitamin D status, dietary intake may be particularly significant during the winter months in areas of high latitude and for those people with minimal sun exposure (O’Mahony et al. 2011; Cashman & Kiely 2012). However, even with a balanced and varied diet, recommended levels may be difficult to achieve, which is why a case for supplementation and the fortification of foods has been put forward by some authorities, especially in Northern Europe.
Food sources of vitamin D and comparison between countries
Foods that make the highest contribution to dietary intakes of vitamin D vary from country to country according to habitual dietary patterns and fortification policies. There is mandatory fortification in some countries and the extent and acceptance of voluntary fortification varies from country to country. The impact of the use of supplements on vitamin D intake will be discussed in a later section.
In non-breastfed infants and very young children, UK dietary surveys show the major contributor to dietary vitamin D intake is formula milk, providing an average of 85% of intake for children aged 4-6 months, 80 and 72% for those aged 7-9 months and 10-11 months, respectively, and 29% for children aged 12-18 months (Lennox et al. 2013). For children aged 4-11 months, the second largest contributor was the food group ‘commercial infant foods’ (9-12%), particularly ‘cereal- based foods and dishes’ (5-7%) that are often fortified. For children aged 12-18 months, the second largest contributor to vitamin D intake was the food group ‘milk and milk products’. In older children aged 1.5-3 years and 4-10 years, foods contributing to vitamin D intake included milk and milk products (24 and 13%, respectively), meat and meat dishes (21 and 25%), fat spreads (20 and 21%) and cereal and cereal products (14 and 20%, with breakfast cereals contributing around 8%). Fish and fish dishes, and egg and egg dishes were reported to contribute around 8% of vitamin D in both these age groups (Bates et al. 2014). Dietary sources of around 700 Flemish children aged 2.5-6.5 years were surveyed between 2002 and 2003 (Huybrechts et al. 2011). Highest amounts of vitamin D were provided by the protein food group (34.2%, with 14.6% from fish, 7.7% from meat and meat products and 4.2% from eggs), followed by fats (25.9%) and milk and milk products (24.9%; ‘growth’ or fortified milks contributed 19.7%).
The Dutch National Food Consumption Survey (DNFCS 2011), in a sample aged 7-69 years, reported fats as being the largest contributor of vitamin D (36%), followed by meat and meat products (20%), fish and shellfish (8%) and cakes (7%). In France, fish is the main dietary source, contributing 31% of dietary intake of vitamin D in children and 38% in adults, with eggs contributing 10 and 9%, respectively, and cheese 9 and 7%, respectively (ANSES 2013). In Spain, the main source is also fish, which accounts for 68% of intake, with eggs contributing 20% and cereals 4% (AESAN 2011). In UK adults, meat and meat products, fish and fat spreads are the main dietary sources (Bates et al. 2014) (Table 9) with a greater contribution from eggs in Asian women compared with Caucasian women shown in the Vitamin D, Food Intake, Nutrition and Exposure to Sunlight in Southern England (D-FINES) study (Darling et al. 2010). For Irish adults, meat (30%), fish (12%) and spreads (10%) also make a significant contribution (Fig. 1). The importance of meat as a source of vitamin D in the UK and Ireland is interesting. In this context it should be highlighted that meat contains vitamin D in relatively small amounts, but it may be an important source as the content is mostly the metabolite 25(OH)D, which on a molar basis may be more biologically active (Uusitalo et al. 2011). However, there is no European consensus on the most appropriate conversion factor to reflect the bioactivity of the metabolite (Cashman 2012), and different potency factors (typically ranging from 1 to 5) are currently used in food composition tables (Uusitalo et al. 2011; DH 2013).
Table 9 Main dietary sources of vitamin D in UK adults
By contrast in the US, vitamin D-fortified milk makes the highest contribution to vitamin D intakes (58% in men, 39% in women), as is the case in Finland where fortified liquid milk and dairy products also contribute significantly (O’Mahony et al. 2011), along with fish and dietary fats. In Sweden, general vitamin D fortification of all low-fat milk and dairy products makes this group a significant contributor to vitamin D intake, along with oil-rich fish such as salmon and herring (Burgaz et al. 2007) and dietary fats. In the other Nordic countries (Iceland and Norway) where milk is not routinely fortified, oil-rich fish and fortified fats are the predominant food sources (Lamberg-Allardt et al. 2013).
Vitamin D intakes in European populations
Mean intakes of vitamin D in European counties vary according to age, gender and supplementation habits (EFSA 2012). Furthermore, accurate comparison of vitamin D intakes in European countries is hampered by different study methodologies, variations in dietary assessment techniques, different age classifications and limitations in food composition tables. Although harmonisation in European dietary research methodology is being worked towards, current comparisons are dependent on existing information. Nonetheless, this provides a useful broad perspective indicating that in many European countries, and in all age groups, there is a notable discrepancy between mean intakes and typical dietary recommendations. European countries are employing different strategies to increase vitamin D intakes, particularly in vulnerable groups.
Although in Scandinavian countries oil-rich fish consumption is relatively high, both fortification and supplementation policies have also been implemented. In contrast, in Germany, the emphasis is on encouraging more outdoor sun exposure. Turkey has an infant supplementation programme but other Southern European countries, such as Spain and Italy, do not have formal fortification or supplementation public health policies.
A recent systematic review considered the effect of socioeconomic status (SES), using education as an indicator, on vitamin D intake in Western Europe (Novakovic et al. 2014). Whereas in Irish adults there was little difference in mean intake between low and high SES groups, there was a much greater difference reported in Switzerland, particularly in men. In children, there was relatively little difference reported in the UK (4%) but a significant difference in Spain (30%).
Vitamin D intake in adults
European intakes, excluding supplements, have been looked at in an EPIC (European Prospective Investigation into Cancer and Nutrition) study using a single, standardised 24-hour dietary recall and a standardised nutrient database. In adults aged 35-74 years in 10 countries: Greece, Spain, Italy, France, Germany, The Netherlands, the UK, Denmark, Sweden and Norway (Freisling et al. 2010). For all countries combined, the daily mean vitamin D intake was reported as 4.8 pg/day for men and 3.3 pg/day for women, but there was considerable variation between countries. Participants in Sweden, for example, reported a high intake of vitamin D, around 80% above the EPIC mean. An EFSA report (EFSA 2012) also found considerable variability in mean intakes in 14 European countries. Mean dietary intake of vitamin D from food alone ranged from 1.1 pg/day (Spain, women, 18-64 years) to 8.2 pg/day (Finland, men, 25-74 years). For food and supplement intake together, lowest mean intake was reported in young Irish women 18-35 years (3.1 pg/day) and the highest in Norwegian adults within the top quartile of n-3 polyunsaturated fatty acids intake (23.5 pg/day).
As part of the EU-funded EURopean micronutrient RECommendations Aligned Network of Excellence (EURRECA) project (Roman Vinas et al. 2011), nutritional survey data were collated from both the European Nutrition and Health Report II (European Nutrition and Health, Elmadfa 2009) and the International Life Sciences Institute (ILSI) Europe Addition of Nutrients to Food Task Force (Flynn et al. 2009). An estimated average requirement (EAR) cut-off point for vitamin D of 10 pg/day (as defined by IOM) was used to estimate the prevalence of nutrient intake adequacy. Mean daily intakes of vitamin D were lowest in Spain (<2 pg/day), between 3 and 4 pg/day in most other countries and higher in Sweden, Finland and Norway (Table 10). For example, in adult males, mean intakes ranged from 1.6 pg/day (Spain) to 10.9 pg/day (Norway), with 46% in Norway and 100% in Portugal, Spain and The Netherlands consuming less than 10 pg/ day. A similar picture was seen in the elderly population, with intakes ranging from 0.7 pg/day (Spain) to 15 pg/ day (Norway); 33% in Norway and 100% in Portugal, Spain and Italy consumed less than 10 pg/day.
The limitations of this review should be taken into account. Data were derived from studies conducted with different methodologies and different assay methods for vitamin D were used, which generally have improved over time making the more recent studies potentially more reliable. Importantly, supplementation was only taken into account in two reports (Norway and Ireland). Because of the between-person variability, comparing the mean intake of the nutrient of interest against the EAR for that nutrient can lead to misinterpretation of the true prevalence of inadequacy. Raw data were not used, which would have allowed more rigorous analysis.
A more recent study (Mensink et al. 2013) reanalysed raw data from European national surveys (Belgium, Denmark, France, Germany, The Netherlands, Poland, Spain and UK), which enabled both uniformity of age group and the use of a single recommendation set. The lower intake level (LI) of 2.5 pg/day vitamin D, as set out in the 2004 NNR, was used to determine very low intakes in each country. LI is defined as a cut-off value below which an intake could lead to clinical deficiency symptoms in most individuals, but it was termed lower reference nutrient intake (LRNI) for consistency in the Mensink et al. paper. The range of mean intakes and the proportion of subjects with vitamin D intakes less than
pg/day are shown in Table 11 for diet only and diet with supplements. In adults, there was generally a high contribution from supplements in Denmark. Indeed, Nordic populations are often noted as being higher habitual supplement consumers. However, although supplements can contribute to higher intakes of vitamin D in individuals that take them, the population average may still be inadequate. Additionally, although defined age ranges were typically used, there were exceptions, notably The Netherlands, where adult data were reported from two distinct surveys for adults aged 19-30 years and 31-60 years, rather than adults aged 18-60 years used in other countries.
As discussed above, comparative reviews provide a broad perspective of vitamin D intakes through Europe, but may not allow more detailed insight into intake patterns and the impact of supplements in individual European nations, or reflect more recent national survey data. For example, Spanish intakes in European reviews have typically been reported to be among the lowest in Europe, but more recent Spanish dietary survey data from la Encuesta Nacional de Ingesta Dietetica (ENIDE) 2011 (AESAN 2011) shows mean intakes in adults of 4.28 pg/day in men and 3.65 pg/day in women. However, the proportion of the Spanish population not reaching the EAR of 10 pg/day was still reported as being between 80 and 90%.
Table 12 Vitamin D intake per I0MJ (not including supplements) in Nordic Countries
Some of the pronounced differences in vitamin D intakes between and within Nordic countries recently reported from national survey data (Nordic Council of Ministers 2014) may be explained both by dietary (Table 12) and supplement intake patterns. In Iceland, 10% have a habitual intake of <3.1 pg/day and 10% have a habitual intake of >21.6 pg/day, largely depending on supplement intake. Young adults aged 18-30 years not taking supplements were found to have a mean intake of 3.9 pg/day, but those taking cod liver oil had a markedly higher mean intake of 13.5 pg/day (Lamberg-Allardt et al. 2013).
Results fromFINDIET2012 (Helidan et al. 2013), the national dietary survey for Finland, also provides interesting data on the impact on mean vitamin D intake of supplement use, indicating differences in intakes are attributable to the contribution from supplements and not to any marked differences in dietary habits. For older men and women who use vitamin D supplements (37 and 60%, respectively) intake from food was only 11.2 and pg/day, respectively. However, supplement intake of 21.3 and 17.8 pg/day increased total mean intake of vitamin D considerably; 32.5 and 26.1 pg/day compared with intakes of 13.7 and 9.2 pg/day for non-users of supplements in older men and women, respectively. Similarly, Danish men and women aged 18-49 years who used supplements had a higher mean vitamin D intake of 7.8 and 7.6 pg/day, respectively, compared with 2.7 and 2.0 pg/day in non-users. Intakes from food only in supplement users were 2.8 and 2.1 pg/day in men and women, respectively, again indicating that differences in vitamin D intakes between users and non-users of supplements were attributable to the contribution from supplements and not food (Tetens et al. 2011).
Data from the Irish Adult Food Consumption Survey (IUNA) (IUNA 2011b) reported a higher impact of supplements in older people, with contribution from supplements increasing the overall population mean intake from 3.1 pg/day (food sources only) to 4.3 pg/ day in those aged 18-64 years and from 3.8 (food sources only) to 6.9 pg/day in older people (aged 65 years and over). In the UK, mean intakes from food sources were some 33% of the UK reference nutrient intake (RNI) (10 pg/day) in older persons aged 65 years and over. Inclusion of intakes from dietary supplements brought their mean intake up to 51% of the RNI, but still remained well below the RNI (Bates et al. 2014).
Vitamin D intake in children
Mensink etal. (2013) in their European review (see ‘Vitamin D intake in adults’) also reported low mean intakes (Table 13). Intakes are given separately for children aged 1-3 years (except children aged 2-3 years in The Netherlands), boys and girls aged 4-10 years (exceptions being children aged 6-10 years in Germany and separately children aged 4-6 and 7-10 years in The Netherlands), boys and girls aged 11-17 years (except children aged 12-17 years in Germany). In children aged 1-3 years (data from four countries only) intakes ranged from 1.3 to 2.3 pg/day, with reported mean intakes in over 75% of this age group below the LRNI (the NNR 2004 LI of 2.5 pg/day). In The Netherlands, supplement use markedly reduced the proportion having intakes below the LRNI from 84 to 26%. Indeed, the most commonly used dietary supplement in 2-3 year-olds was vitamin D, consumed by about 60% of this age group. Nonetheless, a quarter of this age group still had intakes below the LRNI (Mensink et al. 2013). In the UK, low supplement use had a consequent low impact on average intakes in young children (increasing it from 1.9 to 2.3 pg/day) with 74% still having an intake less than LRNI. This review (Mensink et al. 2013) reported comparatively higher mean intake in 7-10 year-olds in the Netherlands, but it should be noted that the results for 7-10 year-olds were taken from older, pre-2003 survey data, when Dutch survey methods changed. In the later 2007-2010 survey data (DNFCS 2011), intake in this age range was somewhat lower. In all other population data reported in the Mensink etal. (2013) review, the proportion of 4-10 year-olds with intakes below the LRNI exceeded 65%. The 2012 EFSA report on upper intake levels of vitamin D outlined a range of intakes in children and adolescents and reported similar results to the data from Mensink and colleagues.
An earlier review, the European Nutrition and Health Report II (European Nutrition and Health, Elmadfa 2007), summarised vitamin D intake in children and adolescents in a wider selection of countries (Table 14) but as in adult reviews that use this type of varied survey data with different methodologies, the ability to draw conclusions is somewhat limited. Highest intakes of vitamin D in children were reported in the Nordic countries, where children aged 10-14 years had intakes of 5.1-6.8 pg/day. In adolescents aged 15-18 years, mean intakes ranged from 1.5 pg/day in Spanish girls to 7.5 pg/day in Norwegian boys, respectively. Intakes were around 2-4 pg/day among adolescents of all ages in every participating country, except for Norwegian boys and girls and Polish boys.
The European Society for Paediatric Gastroenterology, Hepatology and Nutrition (ESPGHAN) recently looked at studies, rather than nationally representative surveys, in the European paediatric population (Braegger etal. 2013). The authors commented on the low number of studies specifically investigating vitamin D intake in European children but concluded that, in general, these also reflect a low intake. In Germany, the DOrtmund Nutritional and Anthropometric Longitudinally Designed Study (DONALD) (Sichert-Hellert et al. 2006) showed that approximately 80% of children aged
0-12 years did not reach a vitamin D intake of 5 pg/day, the recommended intake at that time, and the EsKiMo study (Mensink et al. 2007) also showed that vitamin D intake (mean 1.9 pg/day) was lower than recommended. Similar data were reported in Flemish pre-schoolers; mean intakes of vitamin D from food only were 2.0 pg/ day in children aged 2.5-6.5 years. Intakes of vitamin D decreased with age and only 4% of 2-3 year-olds and 1% of children aged 4-6 years had intakes of vitamin D that met the EAR of 10 pg/day from food (Huybrechts et al. 2011).
As with adult data, looking more closely at national data reveals a more detailed picture. For example, reviews of vitamin D intake do not often consider very young children. In the UK, average vitamin D intake in non-breastfed children under 1 year met the RNI (Fig. 2), whereas mean intakes of vitamin D in those aged 12-18 months were below the RNI (55% of the RNI).
Figure 2 Average daily intake of vitamin D from food sources (not including supplements) for non-breastfed children aged 4-18 months in United Kingdom
For UK breastfed infants aged under 18 months, mean intakes of vitamin D were 37-54% of the RNI across the age groups, although vitamin D intake is likely to be underestimated as contribution from breast milk was not taken into account. A recent study assessed vitamin D intake and status in a healthy group of infants aged 12 months (n = 76) in Iceland, in relation to their regular sources of dietary vitamin D (Thorisdottir et al. 2014). The mean vitamin D intake was reported as 8.8 ± 5.2 g/day. Infants who regularly received both fortified products and supplements had a higher vitamin D intake (14.3 ± 3.0 g/day) than infants who regularly received supplements as a main source (8.8 ± 2.7 g/ day), who in turn had a higher intake than infants who regularly consumed fortified products as a main source. Infants who never, or irregularly, received fortified products or supplements had lower mean vitamin D intakes than the other groups (2.5 ± 1.9g/day, P < 0.001) and lower serum 25(OH)D (P < 0.001).
Verkaik-Kloosterman etal. (2011) modelled data from the Dutch Food Consumption Survey to estimate habitual vitamin D intake from food and supplements among young children aged 2-6 years. The median habitual total intake was higher in dietary supplement users compared with non-users; among children aged 0-3 years, it was 5.5 vs. 1.7 g/day and among children aged 4-6 years it was 3.3 vs. 2.0 g/day. Total vitamin D intakes were below the EAR of 10 g/day in the majority of the population aged 2-6 years, with the exception of around 5% of supplement users. In the UK, mean intakes from food sources alone in children aged 1.5-3 years were 27% of the RNI; inclusion of dietary supplements brought the mean intake up to 32% of the RNI. In boys aged 4-18 years, mean daily vitamin D intake from food sources was 2.2 g/day. When supplements were included, intakes increased to 2.7g/day. Intakes in girls aged 4-18 years increased from 1.9 g/ day from food only to 2.3 g/day from all sources including supplements (Bates et al. 2014). In Ireland, the National Children’s Food Survey and the National Teens’ Food Survey reported median vitamin D intakes of 1.9-2.4 g/day in those aged 5-17 years (Black et al. 2014). The prevalence of vitamin D supplement use was 15-21%, with intakes in supplement users ranging from 6.0-6.7 pg/day; across the age groups 88-96% still had mean intakes below the EAR of 10 pg/day. Foods fortified with vitamin D in Ireland, mainly breakfast cereals, fat spreads and milk, were consumed by 63-71%. Nonsupplement users who consumed vitamin D-fortified foods had median intakes of 1.9-2.5 pg/day, compared with 1.2-1.4 pg/day in those who did not consume fortified foods.
The available evidence shows low vitamin D intakes among European children and adolescents compared with recommendations, as well as a high prevalence of low serum vitamin D concentrations, but with a very low prevalence of overt clinical symptoms. Studies suggest that intake and vitamin D status can be improved by consumption of fortified foods and supplements (either vitamin D supplements, vitamin D-fortified cow’s milk, vitamin D-fortified formula or vitamin D-fortified cereal- based foods) (EFSA 2013). Measures such as encouraging judicious sun exposure and promotion of dietary recommendations covering foods naturally rich in vitamin D are also important (Braegger et al. 2013).
Supplements and fortification - policy and practice
There is recognition that current dietary intakes may not be sufficient to maintain an adequate vitamin D status all year round, even when the lower threshold of 25 nmol/l is used. In light of this, coupled with the increases in many countries of the thresholds used to assess status, the challenge for national, European and international government and health bodies is to determine the most effective policies across all sectors of the population to achieve an appropriate vitamin D status.
There are striking differences across Europe in the use of dietary supplements, including all vitamin, mineral and oil-based supplements (such as cod liver oil and evening primrose oil) (Table 15). A clear north-south gradient has been reported (Skeie et al. 2009), with higher consumption typically in northern European countries and higher use in women than in men. In this survey, crude mean supplement intakes were lowest in Greece (2% in men, 6.7% in women) and highest in Denmark (51.0% in men, 65.8% in women).
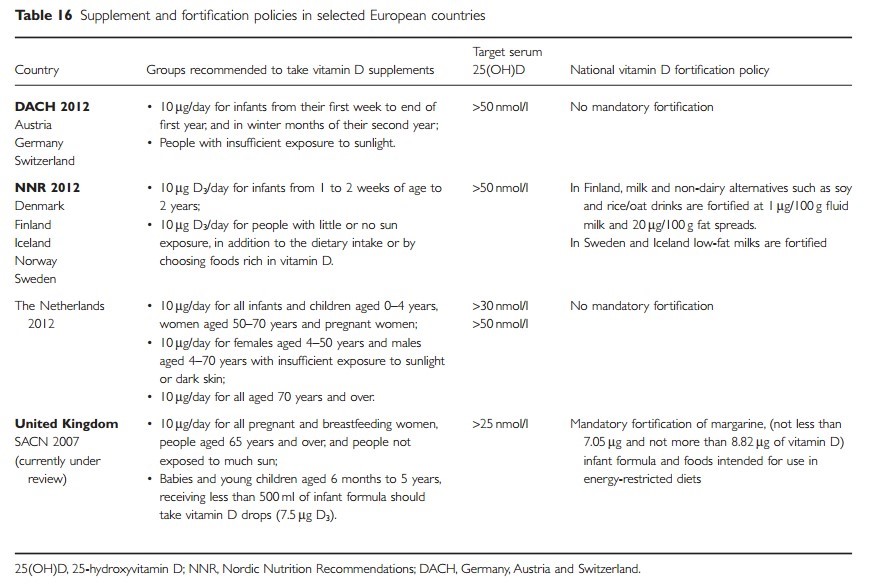
Calvo et al. (2005) examined the relative contributions of diet, fortification and supplementation to vitamin D intake globally, concluding that dietary supplement use may contribute 6-47% of the average vitamin D intake, but current dietary patterns and supplementation practices do not ensure adequate vitamin D status in all population groups in most countries. Some European countries have adopted supplementation and fortification polices for vitamin D but this is not harmonised across the EU (Table 16).
Table 15 Age-adjusted means of usage of all dietary supplements in European countries
Supplementation
New Nordic recommendations (Nordic Council of Ministers 2014) state that from 1-2 weeks of age infants should receive 10 pg/day vitamin D as a supplement. The general recommended intake for those with minimum sun exposure is 20 pg/day, which can be achieved by taking a daily supplement of 10 pg of vitamin D3 in addition to dietary intake, or choosing foods rich in vitamin D. For older people, the recommended intake can be achieved by selecting foods naturally high in vitamin D and vitamin D-enriched foods, in combination with a supplement if necessary. In Sweden, a daily supplementation of 10 pg of vitamin D is recommended for all children aged 0-2 years. This is fully subsidised by the government and provided via child welfare centres. Daily vitamin D supplements are also recommended for children until the age of 5, and adults with dark skin or who have little sun exposure or do not eat fortified foods and fish. Similarly, supplementation is also recommended for pregnant women, for those who wear fully concealing clothing and for housebound or institutionalised people. The guideline for Germany, Austria and Switzerland (German Nutrition Society 2012) is administration of vitamin D supplements to infants from the first week of life to the end of their first year, which should be continued in the second year during the winter months. The ESPGHAN Committee on Nutrition (Braegger et al. 2013) also recommends a daily supplement of 10 pg/day vitamin D for all infants during the first year of life, and indicates that this measure will enable most infants aged 0-12 months to maintain a 25(OH)D concentration of 50 nmol/l.
Nevertheless, there is some evidence in Europe that many infants may not receive the recommended supplementation. Uptake of free vitamin supplements under the Healthy Start scheme for low-income families in the UK (for pregnant mothers and children under 4 years) has been low, possibly due to distribution and access problems, low awareness and poor promotion of the scheme by health professionals (Jessiman et al. 2013). It is important that paediatricians and other healthcare professionals ensure that these preventive strategies are put into practice and that young children in the UK, or other European countries with supplementation recommendations, receive daily vitamin D supplements appropriate for their age. Universal provision has been identified as a potential solution worthy of further research.
Mandatory and voluntary fortification
Supplements are an effective method for individuals to increase their intake, but clearly only if they are taken. Food fortification represents an opportunity to increase the vitamin D supply on a population-wide basis. Well- designed sustainable fortification strategies, which use a range of foods to accommodate different dietary patterns, have the potential to increase vitamin D intakes across population subgroups and minimise the prevalence of low 25(OH)D concentrations. This may be particularly important in countries where uptake of supplements is low.
Vitamin D, as cholecalciferol (D3) and ergocalciferol (D2), is legally permitted to be added to foods listed in Annex I of Regulation (EC) No 1925/2006 [as amended by Commission Regulation (EC) No. 1170/ 2009], with no addition being permitted to unprocessed foods or alcoholic beverages. For a nutrient and/or health claim to be made to consumers, vitamin D concentration in the food product has to be at least 15% (or at least 7.5% for drinks) of the specified EU nutrient reference value (per 100 g) for vitamin D of 5 |ag (EC 2011).
A meta-analysis of 16 randomised controlled trials (RCTs) worldwide, evaluating the efficacy of fortification, found that vitamin D-fortified foods (Black et al. 2012) increased circulating 25(OH)D concentrations in a dose-dependent manner. Using a random effects analysis model, mean individual intake of around 11 Mg/day vitamin D (range 3-25 Mg/day) from fortified foods increased serum 25(OH)D by 19.4 nmol/l (95% CI: 13.9, 24.9), corresponding to a 1.2 nmol/l (95% CI: 0.72, 1.68) increase for each 1 Mg ingested. However, heterogeneity was high, with baseline 25(OH)D ranging from 24.0 to 83.6 nmol/l. The authors identified a need for stronger data on the efficacy of vitamin D-fortified foods on deficiency prevention and potential health outcomes, including adverse effects.
Food fortification policy varies throughout Europe. Mandatory vitamin D fortification of margarine was introduced in some countries in Europe as a way of preventing vitamin D deficiency in children and today many breakfast cereals are also fortified with vitamin D. Finland and Sweden began to fortify their milk with vitamin D in the 1990s but overall, fortification of milk is not widely practiced in Europe.
Some studies have shown a positive impact of ready- to-eat breakfast cereals (RTEC) in relation to vitamin D intake. In Irish adults (NSIFCS survey 1997-1999), RTEC contributed 10% to mean daily intake of vitamin D (Galvin et al. 2003) and higher consumption of breakfast cereals was found to be positively associated with greater vitamin D intakes in UK children aged 4-18 years in the 1997 NDNS (Gibson 2003). In more recent UK NDNS data, fortified breakfast cereals contributed some 8-9% of average daily vitamin D intake in children aged 4-18 years. In Spain, the enKid study (1998-2000) reported that intakes of vitamin D increased significantly in young people aged 2-24 years with increased consumption of RTEC (van den Boom et al. 2006).
Since 2007 in Sweden, there has been mandatory vitamin D fortification in the range of 3.8-5.0 Mg/l of all milk (including organic) with a maximum 1.5% fat content, and fortified milk is one of the main vitamin D sources within the Swedish population. Margarines and fat spreads are required to have a vitamin D level of 7.5-10 Mg/100 g. In Finland, fortification of butter/ spreads and milk products has been widespread since 2003. In comparison with the previous dietary survey in 2002, FINDIET 2007 reported higher average intakes of 7.1 and 5.2 Mg/day among men and women, suggesting that the fortification policy implemented in 2003 produced a slight increase in mean vitamin D intakes. However, vitamin D intake remained below recommendations among women in all age groups and among working age men. The increase in vitamin D fortification of milk products and dietary fats in 2010, as well as revised recommendations on vitamin D supplementation in 2011, were put in place to improve vitamin D intake. According to the latest survey, FINDIET 2012 (Helidan et al. 2013), on average Finnish adults met the vitamin D recommendations, except in older women. Fortification seems to have been an effective way to increase the average vitamin D intake in the Finnish population, but this may not be appropriate for all countries.
The German Federal Institute for Risk Assessment does not recommend vitamin D enrichment of foods for the general population. Consumption of vitamin D-fortified foods is only recommended if inadequate intake has been diagnosed and if a targeted improvement cannot be achieved either by diet or the body’s synthesis through sunlight exposure. The Health Council of the Netherlands (Weggemans et al. 2009) recommends fortification of margarines with a maximum vitamin D of 0.075 Mg/g, with virtually all such products currently being fortified to at least 75% of this level. It also recommended that the type of foodstuffs to which vitamin D can be added should be restricted to milk, milk substitutes (10 Mg/l) and oil (4.5 Mg/100 kcal), rather than allowing it to be added to other products in an unrestricted manner. For baby foods, infant formula, diet foods for medical purposes or food for energy-restricted diets, there is additional legislation in which the minimum and maximum vitamin D levels are set, generally based on EU legislation.
Other suggested vehicles for fortification have included bread, juice and more unusual methods such as UV-treated mushrooms and yeast. The OPTIFORD study concluded that bread was a safe and feasible vehicle for fortification (Natri et al. 2006). A recent German modelling study (Brown et al. 2013) suggested that to raise 25(OH)D serum concentration to 75 nmol/l, 100 g of bread would have to be fortified with 11.3 Mg during winter, resulting in a daily vitamin D intake of 23.7 Mg. EFSA has recently issued a positive opinion on the safety of UV-treated vitamin D-rich baking yeast for use in bread and other yeast-leavened bakery products at maximum concentrations of 5 Mg of vitamin D2/100 g of these foods.
The problem of fortifying a single staple, e.g. milk, or focusing on a commodity sector such as dairy, is that it does not increase the vitamin D supply in nonconsumers and may be problematic in countries where lactose intolerance is prevalent. Additionally, it has been suggested that several fortified carriers with low concentration are a better option for fortification polices as if only limited foods are fortified with high vitamin D concentrations, the toxicity risk may be higher for those who consume large quantities of these foods (Brown et al. 2013).
Vitamin D2 or vitamin D3
There is some controversy regarding the comparative effectiveness of vitamin D2 (ergocalciferol) and D3 (cholecalciferol) in raising and maintaining serum 25(OH)D levels.
There are a number of small molecular structural differences that may be significant, yet Holick et al. (2008) reported vitamin D2 to be as effective as vitamin D3 in maintaining circulating concentrations of 25(OH)D. In a small RCT, a daily 25 Mg dose of vitamin D2 was found to be as effective as 25 Mg vitamin D3 in maintaining blood 25(OH)D after 11 weeks. However, in a recent systematic review (Tripkovic et al. 2012), 8 out of 10 RCTs identified, plus a meta-analysis of these studies found vitamin D3 to be significantly more effective at raising serum 25(OH)D concentrations compared with vitamin D2 (P = 0.001), and thus vitamin D3 could potentially become the preferred choice for supplementation. When the frequency of dose administration was compared in a further analysis, there was a significant response for administration of vitamin D3 compared with vitamin D2 when given as a large bolus dose (single or multiple, weekly or monthly, P = 0.0002), although the difference in increase was non-significant with daily supplementation.
Vitamin D toxicity
Excessive intake of vitamin D is associated with an increase in circulating 25(OH)D, which may lead to increased intestinal absorption and bone resorption of calcium, in turn leading to hypercalcaemia and can in certain cases lead to renal failure and cardiac arrest. Signs of vitamin D intoxication include anorexia, vomiting, headache, risk of calcification of soft tissues and presence of urinary calcium stones (NIH 2011).
Tolerable upper intake levels (UL) have recently been set both by the EU Scientific Committee on Food/ EFSA (SCF 2006) and by IOM to ensure that total intakes do not pose risks for public health, or more precisely as the maximum level of chronic daily intake of vitamin D intake unlikely to pose a risk to adverse health effects for almost all individuals in the general population (see Table 17). The EU established a UL of 25 Mg/day for infants and children aged 10 years or younger and 50 Mg/day from 11 years and older. The adult UL for vitamin D is derived from the risk of hypercalciuria/hypercalcaemia, which has been demonstrated to increase in some parts of the population with a dietary intake above 100 Mg/day. Using an uncertainty factor of 2, the UL for adults is set at 50 Mg/day. For the age group 2-17 years, there is little data on high level intake to support the derivation of a UL. However, studies suggest that susceptibility to excess vitamin D changes with age. Infants may be especially sensitive to hypercalcaemia resulting from vitamin D toxicity. It has been suggested that doses of more than 250 Mg/day, which raise 25(OH)D levels to more than 150 ng/ml, are associated with hypercalcaemia and hyperphosphatamia (high phosphate level in the blood) (Holick 2007).
The 2012 NNR also estimate an upper limit of 100 Mg/day in adults. The UK Expert Group on Vitamins and Minerals proposed that a level of 25 Mg/day of supplementary vitamin D would not be expected to lead to adverse effects when consumed frequently over a long period of time (Expert Group on Vitamins and Minerals 2003).
Risk of toxicity
Excessive sunlight exposure does not cause vitamin D3 toxicity (IOM 2011). Nevertheless, extensive exposure of bare skin to sunlight is to be avoided as it increases the risk of skin cancer.
However, exposure to high doses of vitamin D via supplements has been shown to have toxic effects (Vieth 2006), although vitamin D toxicity is thought to be rare.
One of the ways to investigate the risk posed by fortification is to look at the intake of the highest consumers compared with the UL set.
Table 17
Flynn et al. collected and evaluated data on intakes of vitamin D in conventional foods, food supplements and fortified foods in adults and children in Denmark, Germany, Finland, Ireland, Italy, The Netherlands, Poland, Spain and the UK. Intake of high consumers, defined as the 95th percentile (P95), was compared with the UL (Flynn et al. 2009).
In adults, the P95 of total intake of vitamin D (including supplements and voluntary fortification) is well below the UL, even in countries where there is a wide use of supplements (Denmark and Finland) and where there is semi-mandatory fortification of milk with vitamin D (Finland). The P95 intake of vitamin D from voluntarily fortified foods is low and inclusion of intake from voluntarily fortified foods with that from the base diet and also supplements had little effect on P95 intakes in both men and women.
For children and adolescents, the P95 of vitamin D intake from the base diet ranged from 2.3 to 5.9 and 3.0 to 9.7 pg/day in the age groups 4-10 and 11-17 years, respectively. From the limited data available, intake from supplements and fortified foods are low (except for supplements in Denmark) and inclusion of these sources with the base diet has only a minimal effect on P95 intake. In children, the P95 of total intake of vitamin D (including supplements and voluntary fortification) is well below the UL, even in countries where there is a wide use of supplements.
Recent dietary data from Finland, FINDIET 2012 (Helidan et al. 2013) allow an up-to-date insight into the impact of supplementation in countries where fortification of foods is common. The data show that mean vitamin D intakes (including fortified sources) were in adult men and women, respectively, 11.2 and
pg/day for non-supplement users and 29.5 and 24.7 pg/day for supplement users. In addition, vitamin D intake in supplement users at P75 (the figure used in this survey to look at high consumers in the distribution) ranged from 12.4 to 16.4 pg/day from food sources only, but 29.2-58.8 pg/day from food and supplements. The use of vitamin D supplementation raised total mean vitamin D intake considerably compared with recommendations, both among men and women in all age groups. The Finnish data would suggest that the combined intake from dietary sources including fortified foods is unlikely to result in excess intakes. This may not be the case for high supplement users but there are currently no studies that have investigated the impact of chronic high supplement intake. In the UK, DH (NHS Choices 2013) reports that vitamin D toxicity is uncommon and usually only affects people who have been taking vitamin D supplements well above the recommended dosage for several months. However, some medical conditions can increase sensitivity to the effects of vitamin D, such as liver or kidney disease.
Conclusion
Various national and European strategies have been suggested to facilitate the achievement of adequate vitamin D status in European populations which include:
following a healthy lifestyle associated with a normal BMI, including a varied diet with vitamin D-containing foods (such as oil-rich fish and eggs) and adequate outdoor activities with associated sun exposure;
adopting policies aimed at improving vitamin D status using measures such as promotion of dietary recommendations, food fortification, vitamin D supplementation and judicious sun exposure, taking into account individual national policy and dietary habits;
oral supplementation of vitamin D of high-risk groups, although it is important that supplementation use is monitored and effective methods of ensuring uptake in these groups are found and implemented.
Variations in regional latitudes, sunlight exposure, ethnicity, culture, dietary and dress habits, access to health care, food fortification policies and adherence to public health advice on sun protection are likely to influence the outcomes of any strategies implemented to improve vitamin D status in Europe. It is important to recognise that such national variations may mean that a ‘one-size-fits-all’ policy to improve vitamin D status may not be appropriate or effective throughout Europe.
Improvement in use of standardised methods in measurements relating to vitamin D status and intake will allow the development of a more robust evidence base to underlie policy. There is also a paucity of good-quality evaluations of the impact of programmes intended to increase vitamin D status in the population. RCTs, rather than observational studies, to adequately evaluate vitamin D programme interventions may be necessary. For example, observational supplementation studies may not be able to identify any spontaneous recovery from low vitamin D status in summer months.
Further research will be needed to explore some of the conclusions of this review and address key questions relating to vitamin D in order to provide stronger evidence on which to base action to prevent vitamin D deficiency in Europe. One such initiative, the EU-funded Food-based solutions for optimal vitamin D nutrition and health through the life cycle (ODIN) project is establishing an internationally standardised analytical platform for 25(OH)D in order to more accurately measure the distribution of circulating 25(OH)D and describe the prevalence of vitamin D deficiency among Europeans. ODIN will also delineate the relative contributions of sun and dietary sources of vitamin D to circulating 25(OH)D using biobanks and data from national nutrition surveys. In support of planned EFSA revisions to vitamin D recommendations, ODIN will carry out RCTs in pregnant women, children and teenagers and ethnic immigrant groups to provide experimental data clarifying vitamin D intake requirements. In addition, dietary modelling and innovative food-based solutions, such as bio-fortification, that have the potential to increase vitamin D in the food supply will be explored.
In the meantime, a detailed review of vitamin D is taking place under the auspices of the UK government by the independent Scientific Advisory Committee on Nutrition, whose remit is to review the DRVs for vitamin D intake and make recommendations. This is likely to include an up-to-date risk assessment of the vitamin D status of the UK population and include consideration of biochemical indicators of vitamin D status; the association between vitamin D status and various health outcomes; the risks of skin damage and other adverse effects associated with sunlight exposure; potential adverse effects of high vitamin D intakes; and the relative contributions of diet and cutaneous vitamin D synthesis to vitamin D status in the UK.
Acknowledgement
The British Nutrition Foundation is grateful to Kellogg’s Europe for financially supporting time spent on the preparation of the review. We would further like to thank the European Nutrition Foundations’ Network who have provided vitamin D data from their respective nations, and met to discuss the review at a consensus meeting in London in May 2012.
References
Adami S, Viapiana O, Gatti D et al. (2008) Relationship between serum parathyroid hormone, vitamin D sufficiency, age, and calcium intake. Bone 42: 267-70.
AESAN (Agencia Espanola de Seguridad Alimentaria y Nutrición) (2011) Evaluación nutricional de la dieta espańola. II Micronutrientes. Sobredatos de la Encuesta Nacional de Ingesta Dietetica (ENIDE). Available at: http://aesan.msssi.gob.es/AESAN/docs/docs/evaluacionriesgos/estudiosevaluacion nutricional/ValoracionnutricionalENIDEmicronutrientes.pdf (accessed 11 April 2014).
Afssa (Agence franęaise de securite sanitaire des aliments) (2001) Apports nutritionnels conseilles pour la population franęaise. Editions Tec&Doc;, Paris, France.
Ahmed SF, Franey C & McDevitt H (2011) Recent trends and clinical features of childhood vitamin D deficiency presenting to a children’s hospital in Glasgow. Archives of Disease in Childhood 96: 694-6.
Almirall J, Vaqueiro M, Bare ML et al (2010) Association of low serum 25-hydroxyvitamin D levels and high arterial blood pressure in the elderly. Nephrology, Dialysis, Trans-plantation 25: 503-9.
Andersen R, Molgaard C, Skovgaard LT et al. (2005) Teenage girls and elderly women living in northern Europe have low winter vitamin D status. European Journal of Clinical Nutrition 59: 533-41.
Andersen R, M0lgaard C, Skovgaard LT et al. (2008) Pakistani immigrant children and adults in Denmark have severely low vitamin D status. European Journal of Clinical Nutrition 62: 625-34.
ANSES - French Agency for Food, Environmental and Occupational Health & Safety (2013) Vitamin D presentation, food sources and nutritional needs. Available at: http://www.anses.fr/ en/content/vitamin-d (accessed 11 April 2014).
Arneson WL & Arneson DL (2013) Current methods for routine clinical laboratory testing of vitamin D levels. Laboratory Medicine 44:e38-42.
Ashwell M, Stone EM, Stolte H et al. (2010) UK Food Standards Agency Workshop Report: an investigation of the relative contributions of diet and sunlight to vitamin D status. British Journal of Nutrition 104: 603-11.
Austrian Nutrition Report (2012) Osterreichischer Ernahrungsbericht 2012. Bundesministerium fur Gesundheit, Wien, 2012 Available at: http://www.bmg.gv.at/cms/home/attachments/4/5/3/CH1048/CMS1348749794860/oeb12.pdf (accessed 11 April 2014).
Autier P, Boniol M, Pizot C et al. (2014) Vitamin D status and ill health: a systematic review. The Lancet. Diabetes & Endocrinology 2: 76-89.
Bates CJ, Carter GD, Mishra GD et al. (2003) In a population study, can parathyroid hormone aid the definition of adequate vitamin D status? A study of people aged 65 years and over from the British National Diet and Nutrition Survey. Osteoporosis International 14: 152-9.
Bates B, Lennox A, Prentice A et al. (2014) National Diet and Nutrition Survey Results from Years 1, 2, 3 and 4 (combined) of the Rolling Programme (2008/2009-2011/2012). Public Health England, Food Standards Agency: London.
Beck-Nielsen SS, Brock-Jacobsen B, Gram J et al. (2009) Incidence and prevalence of nutritional and hereditary rickets in southern Denmark. European Journal of Endocrinology 160: 491-7.
Black LJ, Seamans KM, Cashman KD et al. (2012) An updated systematic review and meta-analysis of the efficacy of vitamin D food fortification. Journal of Nutrition 142: 1102-8.
Black LJ, Walton J, Flynn A et al. (2014) Adequacy of vitamin D intakes in children and teenagers from the base diet, fortified foods and supplements. Public Health Nutrition 17: 721-31.
Blain H, Jaussent A, Thomas E et al. (2009) Low sit-to-stand performance is associated with low femoral neck bone mineral density in healthy women. Calcified Tissue International 84: 26675.
Boonen S, Lesaffre E, Dequeker J et al. (1996) Relationship between baseline insulin-like growth factor-I (IGF-I) and femoral bone density in women aged over 70 years: potential implications for the prevention of age-related bone loss. Journal of the American Geriatrics Society 44: 1301-6.
Boonen S, Cheng XG, Nijs J et al. (1997) Factors associated with cortical and trabecular bone loss as quantified by peripheral computed tomography (pQCT) at the ultradistal radius in aging women. Calcified Tissue International 60: 164-70.
Bouillon R, Van Schoor NM, Gielen E et al. (2013) Optimal vitamin D status: a critical analysis on the basis of evidence-based medicine. The Journal of Clinical Endocrinology & Metabolism 98: E1283-304.
Braegger C, Campoy C, Colomb V, on behalf of the ESPGHAN Committee on Nutrition et al. (2013) Vitamin D in the healthy European paediatric population. Journal of Pediatric Gastroenterology and Nutrition 56: 692-701.
Brot C, Jorgensen N, Madsen OR et al. (1999) Relationships between bone mineral density, serum vitamin D metabolites and calcium: phosphorus intake in healthy perimenopausal women. Journal of Internal Medicine 245: 509-16.
Brown J, Sandmann A, Ignatius A et al. (2013) New perspectives on vitamin D food fortification based on a modeling of 25(OH)D concentrations. Nutrition Journal 12: 151.
Brustad M, Alsaker E, Engelsen O et al. (2004) Vitamin D status of middle-aged women at 65-71 degrees N in relation to dietary intake and exposure to ultraviolet radation. Public Health Nutrition 7: 327-35.
Bruyere O, Malaise O, Neuprez A et al. (2007) Prevalence of vitamin D inadequacy in European postmenopausal women. Current Medical Research and Opinion 23: 1939 4.
Burgaz A, Akesson A, Oster A et al. (2007) Associations of diet, supplement use, and ultraviolet B radiation exposure with vitamin D status in Swedish women during winter. American Journal of Clinical Nutrition 86: 1399-404.
Burgaz A, Akesson A, Michaelsson K et al. (2009) 25-Hydroxyvitamin D accumulation during summer in elderly women at latitude 60 degrees N. Journal of Internal Medicine 266: 476-83.
Burnand B, Sloutskis D, Gianoli F et al. (1992) Serum 25-hydroxyvitamin D: distribution and determinants in the Swiss population. The American Journal of Clinical Nutrition 56: 53742.
Callaghan AL, Moy RJ, Booth IW et al. (2006) Incidence of symptomatic vitamin D deficiency. Archives of Disease in Childhood 91: 606-7.
Calvo MS, Calvo MS, Whiting SJ et al. (2005) Vitamin D intake: a global perspective of current status. The Journal of Nutrition 135:310-16.
Cancer Research UK (2010) Vitamin D ex-pert re-view. Available at: http://www.nice.org.uk/nicemedia/live/11871/49665/49665.pdf (accessed 11 April 2014).
Carnevale V, Modoni S, Pileri M et al. (2001) Longitudinal evaluation of vitamin D status in healthy subjects from southern Italy: seasonal and gender differences. Osteoporosis International 12: 1026-30.
Cashman KD (2012) The role of vitamers and dietary-based metabolites of vitamin D in prevention of vitamin D deficiency. Food & Nutrition Research 56: 5383.
Cashman KD & Kiely M (2014) Recommended dietary intakes for vitamin D: where do they come from, what do they achieve and how can we meet them? Journal of Human Nutrition and Dietetics. doi: 10.1111/jhn.12226.
Cashman KD, Hill TR, Lucey AJ et al. (2008) Estimation of the dietary requirement for vitamin D in healthy adults. The American Journal of Clinical Nutrition 88: 1535-42.
Chapuy MC, Preziosi P, Maamer M et al. (1997) Prevalence of vitamin D insufficiency in an adult normal population. Osteoporosis International 7: 439^3.
Crowe FL, Steur M, Allen NE et al. (2011) Plasma concentrations of 25-hydroxyvitamin D in meat eaters, fish eaters, vegetarians and vegans: results from the EPIC-Oxford study. Public Health Nutrition 14: 340-6.
DACH (Deutsche Gesellschaft fur Ernahrung - Osterreichische Gesellschaft fur Ernahrung - Schweizerische Gesellschaft fur Ernahrungsforschung - Schweizerische Vereinigung fur Ernahrung) (2013) Referenzwerte fur die Nahrstoffzufuhr. Umschau Braus Verlag, Frankfurt am Main, Germany.
Dalgard C, Petersen MS, Schmedes AV et al. (2010) High latitude and marine diet: vitamin D status in elderly Faroese. The British Journal of Nutrition 104: 914-18.
Darling AL, Lee PA, Tan L et al. (2010) Relative contributions of different food groups to vitamin D intake in Asian and Caucasian UK women: results from the Vitamin D, Food Intake, Nutrition and Exposure to Sunlight in Southern England (D-FINES) Study. Proceedings of the Nutrition Society 69 (OCE1): E44.
Darling AL, Hart KH, Macdonald HM et al. (2013) Vitamin D deficiency in UK South Asian Women of childbearing age: a comparative longitudinal investigation with UK Caucasian women. Osteoporosis International 24: 477-88.
Davies JH & Shaw NJ (2011) Editorials: preventable but no strategy: vitamin D deficiency in the UK. Archives of Disease in Childhood 96: 614-15.
Davies PS, Bates CJ, Cole TJ et al. (1999) Vitamin D: seasonal and regional differences in preschool children in Great Britain. European Journal of Clinical Nutrition 53: 195-8.
Dawodu A & Akinbi H (2013) Vitamin D nutrition in pregnancy: current opinion international. Journal of Womens Health 5: 33343.
DH (Department of Health) (1991) Dietary reference values for food energy and nutrients for the United Kingdom. Report of the Panel on Dietary Reference Values of the Committee on Medical Aspects of Food Policy. HM Stationary Office, London, UK.
DH (Department of Health) (1998) Nutrition and Bone Health: with particular reference to calcium and vitamin D no. 49. London: The Stationary Office.
DH (Department of Health) (2013) Nutrient analysis of fish and fish products and nutrient analysis of eggs summary re-port. Department of Health: London. Available at: https://www .gov.uk/government/uploads/system/uploads/attachmentdata/file/ 167921/Nutrientanalysisoffishandfishproducts- SummaryReport.pdf; https://www.gov.uk/government/uploads/system/uploads/attachmentdata/file/167972/ NutrientanalysisofeggsSummaryReport.pdf (accessed 29 May 2014).
DNFCS (Dutch National Food Consumption Survey) (2011) Dutch National Food Consumption Survey 2007-2010. Diet of children and adults 7 to 69 years. Bilthoven: RIVM.
Doets EL, De Wit LS, Dhonukshe-Rutten RA et al. (2008) Current micronutrient recommendations in Europe: towards understanding their differences and similarities. European Journal of Nutrition 47 (S1): 17-40.
EC (European Commission) ( 2011) Regulation EU No 1169/2011 of the European Parliament and of the Council of 25 October 2011 on the provision of food information to consumers. Official Journal of the European Union L 304: 18-63.
EFSA (European Food Safety Authority) (2009) Scientific Opinion on the substantiation of health claims related to vitamin D and maintenance of bone and teeth, absorption and utilisation of calcium and phosphorus and maintenance of normal blood calcium concentrations, cell division and thyroid function pursuant to Article 13(1) of Regulation (EC) No 1924/2006. EFSA Journal 7: 1227.
EFSA (European Food Safety Authority) (2010) Scientific Opinion on the substantiation of health claims related to vitamin D and normal function of the immune system and inflammatory response, maintenance of normal muscle function and maintenance of normal cardiovascular function pursuant to Article 13(1) of Regulation (EC) No 1924/2006. EFSA Journal 8: 1468.
EFSA (European Food Safety Authority) (2012) Scientific opinion on the tolerable upper intake level of vitamin D. EFSA Journal 10: 2813.
EFSA (European Food Safety Authority) (2013) Scientific opinion on nutrient requirements and dietary intakes of infants and young children in the European Union. EFSA Journal 11: 3408.
EFSA (European Food Safety Authority) (2014) Scientific Opinion on the substantiation of a health claim related to vitamin D and contribution to normal bone and tooth development pursuant to Article 14 of Regulation (EC) No 1924/2006. EFSA Journal 12: 3579.
Elia M & Stratton RJ (2005) Geographical inequalities in nutrient status and risk of malnutrition among English people aged 65 y and older. Nutrition 21: 1100-6.
European Nutrition and Health Report, Elmadfa (2009) European Nutrition and Health Report 2009. Forum of Nutrition 62: 1-405.
Expert Group on Vitamins and Minerals (2003) Safe Upper Levels for Vitamins and Minerals. Food Standards Agency: London.
Flynn A, Hirvonen T, Mensink GB et al. (2009) Intake of selected nutrients from foods, from fortification and from supplements in various European countries. Food & Nutrition Research 53:5-10.
Freisling H, Fahey MT, Moskal A et al. (2010) Region-specific nutrient intake patterns exhibit a geographical gradient within and between European countries. The Journal of Nutrition 140: 1280-6.
Frost M, Abrahamsen B, Nielsen TL et al. (2010) Vitamin D status and PTH in young men: a cross-sectional study on associations with bone mineral density, body composition and glucose metabolism. Clinical Endocrinology (Oxford) 73: 573-80.
FSA (Food Standards Agency) (2002) McCance and Widdowsons the Composition of foods 6th Summary Edition. Royal Society of Chemistry: Cambridge.
FSAI (Food Safety Authority of Ireland) (1999) Recommended dietary allowances for Ireland, Dublin.
Galvin MA, Kiely M & Flynn A (2003) Impact of ready-to-eat breakfast cereal (RTEBC) consumption on adequacy of micronutrient intakes and compliance with dietary recommendations in Irish adults. Public Health Nutrition 6: 351-63.
Gerdhem P, Ringsberg KA, Obrant KJ et al. (2005) Associ ation between 25-hydroxy vitamin D levels, physical activity, muscle strength and fractures in the prospective population-based OPRA Study of Elderly Women. Osteoporosis International 16: 142531.
German Nutrition Society (2012) New reference values for vitamin D. Annals of Nutrition and Metabolism 60: 241-6.
Gibson S (2003) Micronutrient intakes, micronutrient status and lipid profiles among young people consuming different amounts of breakfast cereals: further analysis of data from the National Diet and Nutrition Survey of Young People aged 4 to 18 years. Public Health Nutrition 6: 815-20.
Gomez JM, Maravall FJ, Gomez N et al. (2004) Relationship between 25-(OH) D3, the IGF-I system, leptin, anthropometric and body composition variables in a healthy, randomly selected population. Hormone and Metabolic Research 36:48-53.
Gonzalez-Molero I, Morcillo S, Valdes S et al. (2011) Vitamin D deficiency in Spain: a population-based cohort study. European Journal of Clinical Nutrition 65: 321-8.
Grimnes G, Emaus N, Joakimsen RM et al. (2010) Baseline serum 25-hydroxyvitamin D concentrations in the Tromso Study 1994-95 and risk of developing type 2 diabetes mellitus during 11 years of follow-up. Diabetic Medicine 27: 1107-15.
Hagstrom E, Hellman P, Larsson TE et al. (2009) Plasma parathyroid hormone and the risk of cardiovascular mortality in the community. Circulation 119: 2765-71.
Hatun S, Ozkan B & Bereket A (2011) Vitamin D deficiency and prevention: Turkish experience. Acta Paediatrica 100: 1195-9.
Health Council of the Netherlands (2000) Dietary reference intakes: calcium, vitamin D, thiamin, riboflavin, niacin, pantothenic acid, and biotin. The Hague: Health Council of the Netherlands, publication no. 2000/12.
Health Council of the Netherlands (2012) Evaluation of dietary reference values for vitamin D. The Hague: Health Council of the Netherlands, publication no. 2012/15E.
Hekimsoy Z, Dinę G, Kafesęiler S et al. (2010) Vitamin D status among adults in the Aegean region of Turkey. BMC Public Health 23: 782.
Hilger J, Friedel A, Herr R et al. (2014) A systematic review of vitamin D status in populations worldwide. British Journal of Nutrition 111: 23-45.
Helidan A, Kosonen M, Tapanainen H et al. (2013) The National FINDIET 2012 Survey Helsinki National Institute for Health and Welfare 2013 Report No 16/2013. Available at: https:// www.julkari.fi/handle/10024/110839 (accessed 27 May 2014).
Hill T, Collins A, O’Brien M et al. (2005) Vitamin D intake and status in Irish postmenopausal women. European Journal of Clinical Nutrition 59: 404-10.
Hintzpeter B, Mensink GB, Thierfelder W et al. (2008a) Vitamin D status and health correlates among German adults. European Journal of Clinical Nutrition 62: 1079-89.
Hintzpeter B, Scheidt-Nave C, Muller MJ et al. (2008b) Higher prevalence of vitamin D deficiency is associated with immigrant background among children and adolescents in Germany. The Journal of Nutrition 138: 1482-90.
Hoge Gezondheidsraad (2009) Voedingsaanbevelingen voor Belgie. herziening 2009. Brussel: Hoge Gezondheidsraad; HGR nr. 8309.
Holick MF (2004) Sunlight and vitamin D for bone health and prevention of autoimmune diseases, cancers, and cardiovascular disease. American Journal of Clinical Nutrition 80: 1678S-88S.
Holick MF (2007) Vitamin D deficiency. The New England Journal of Medicine 357: 266-81.
Holick MF (2010) The vitamin D deficiency pandemic: a forgotten hormone important for health. Public Health Reviews 32: 26783.
Holick MF, Biancuzzo RM, Chen TC et al. (2008) Vitamin D2 is as effective as vitamin D3 in maintaining circulating concentrations of 25-hydroxyvitamin D. The Journal of Clinical Endocrinology and Metabolism 93: 677-81.
Holick MF, Binkley NC, Bischoff-Ferrari HA et al. (2011) Evaluation, treatment, and prevention of vitamin D deficiency: an Endocrine Society clinical practice guideline. The Journal of Clinical Endocrinology & Metabolism 96: 1911-30.
Huybrechts I, Lin Y, De Keyzer W et al. (2011) Dietary sources and sociodemographic and economic factors affecting vitamin D and calcium intakes in Flemish preschoolers. European Journal of Clinical Nutrition 65: 1039-47.
Hypponen E & Power C (2007) Hypovitaminosis D in British adults at age 45 y: nationwide cohort study of dietary and lifestyle predictors. The American Journal of Clinical Nutrition 85: 860-8.
IOM (Institute of Medicine) (2011) Dietary Reference Intakes for Calcium and Vitamin D. The National Academies Press: Washington, DC.
Isaia G, Giorgino R, Rini G et al. (2003) Prevalence of
hypovitaminosis D in elderly women in Italy: clinical consequences and risk factors. Osteoporosis International 14: 577-82.
IUNA (Irish Universities Nutrition Alliance) (2011a) National Adult Nutrition Survey. Summary Report March 2011. Available at: http://www.iuna.net/wp-content/uploads/2010/12/National-Adult-Nutrition-Survey-Summary-Report-March-2011.pdf (accessed 11 April 2014).
IUNA (Irish Universities Nutrition Alliance) (2011b) Chapter 3 - nutrient intakes. Summary tables - vitamin tables. Available at: http://www.iuna.net/wp-content/uploads/2011/04/Vitamin-Tables- 3.30-to-3.47.pdf (accessed 11 April 2014).
Japelt RB & Jakobsen J (2013) Vitamin D in plants: a review of occurrence, analysis, and biosynthesis. Frontiers in Plant Science 4: 136.
Jessiman T, Cameron A, Wiggins M et al. (2013) A qualitative study of uptake of free vitamins in England. Archives of Disease in Childhood 98: 587-91.
Kienreich K, Tomaschitz A, Verheyen N et al. (2013) Vitamin D and cardiovascular disease. Nutrients 5: 3005-21.
Koenig J & Elmadfa I (2000) Status of calcium and vitamin D of different population groups in Austria. International Journal for Vitamin and Nutrition Research 70: 214-20.
Krieg MA, Cornuz J, Jacquet AF et al. (1998) Influence of anthropometric parameters and biochemical markers of bone metabolism on quantitative ultrasound of bone in the institutionalized elderly. Osteoporosis International 8: 115-20.
Kristinsson JO, Valdimarsson O, Sigurdsson G et al. (1998) Serum 25-hydroxyvitamin D levels and bone mineral density in 16-20 years-old girls: lack of association. Journal of Internal Medicine 243: 381-8.
Kuchuk NO, Pluijm SM, van Schoor NM et al. (2009) Relationships of serum 25-hydroxyvitamin D to bone mineral density and serum parathyroid hormone and markers of bone turnover in older persons. Journal of Clinical Endocrinology and Metabolism 94: 1244-50.
Kudlacek S, Schneider B, Peterlik M et al. (2003) Assessment of vitamin D and calcium status in healthy adult Austrians. European Journal of Clinical Investigation 33: 323-31.
Lamberg-Allardt CJ, Outila TA, Karkkainen MU et al. (2001) Vitamin D deficiency and bone health in healthy adults in Finland: could this be a concern in other parts of Europe? Journal of Bone and Mineral Research 16: 2066-73.
Lamberg-Allardt C, Brustad M, Meyer HE et al. (2013) Vitamin D - a systematic literature review for the 5th edition of the Nordic Nutrition Recommendations. Food & Nutrition Research 3: 57.
Lanham-New SA, Buttriss JL, Miles LM et al. (2011) Proceedings of the rank forum on vitamin D. The British Journal of Nutrition 105: 144-56.
Lapatsanis D, Moulas A, Cholevas V et al. (2005) Vitamin D: a necessity for children and adolescents in Greece. Calcified Tissue International 77: 348-55.
Lennox A, Sommerville J, Ong K et al. (2013) Diet and nutrition survey of infants and young children, 2011. Available at: https://www.gov.uk/government/uploads/system/uploads/attachmentdata/file/139572/DNSIYCUKreportALLchaptersDH_V10.0.pdf (accessed 7 May 2014).
Lips P (2007) Vitamin D status and nutrition in Europe and Asia. The Journal of Steroid Biochemistry and Molecular Biology 103: 620-5.
Lowik MR, Schrijver J, Odink J et al. (1990) Nutrition and aging: nutritional status of “apparently healthy” elderly (Dutch nutrition surveillance system). Journal of the American College of Nutrition 9: 18-27.
MacFarlane GD, Sackrison JL Jr, Body JJ et al. (2004)
Hypovitaminosis D in a normal, apparently healthy urban European population. Journal of Steroid Biochemistry and Molecular Biology 89: 621-2.
McCarthy D, Collins A, O’Brien M et al. (2006) Vitamin D intake and status in Irish elderly women and adolescent girls. Irish Journal of Medical Science 175: 14-20.
Mattila C, Knekt P, Mannisto S et al. (2007) Serum
25-hydroxyvitamin D concentration and subsequent risk of type 2 diabetes. Diabetes Care 30: 2569-70.
Melin A, Wilske J, Ringertz H et al. (2001) Seasonal variations in serum levels of 25-hydroxyvitamin D and para thyroid hormone but no detectable change in femoral neck bone density in an older population with regular out door exposure. Journal of the American Geriatrics Society 49: 1190-6.
Mensink GB, Bauch A, Vohmann C et al. (2007) EsKiMo: the nutrition module in the German Health Interview and Examination Survey for Children and Adolescents (KiGGS)]. Bundesgesundheitsblatt, Gesundheitsforschung, Gesundheitsschutz 50: 902-8.
Mensink GB, Fletcher R, Gurinovic M etal. (2013) Mapping low intake of micronutrients across Europe. The British Journal of Nutrition 110: 755-73.
Meyer HE, Falch JA, Sogaard AJ et al. (2004) Vitamin D deficiency and secondary hyperparathyroidism and the association with bone mineral density in persons with Pakistani and Norwegian background living in Oslo, Norway, The Oslo Health Study. Bone 35: 412-17.
Mithal A, Wahl DA, Bonjour JP et al. (2009) Global vitamin D status and determinants of hypovitaminosis D. Osteoporosis International 20: 1807-20.
Moreiras O, Carbajal A, Cabrera L et al. (2013) Tablas de composición de alimentos/Guia de Prdcticas, 16th edn. Ediciones Piramide: Madrid.
Moreno-Reyes R, Carpentier YA, Boelaert M et al. (2009) Vitamin D deficiency and hyperparathyroidism in relation to ethnicity: a cross-sectional survey in healthy adults. European Journal of Nutrition 48: 31-7.
Mughal Z (2012) Resurgence of vitamin D deficiency rickets in the UK. Endocrine Abstracts 28: S7.4.
Muray S, Marco MP, Craver L et al. (2006) Influence of mineral metabolism parameters on pulse pressure in healthy subjects. Clinical Nephrology 66: 411-17.
Napiorkowska L, Budlewski T, Jakubas-Kwiatkowska W et al. (2009) Prevalence of low serum vitamin D concentration in an urban population of elderly women in Poland. Polish Archives of Internal Medicine 119: 699-703.
Natri AM, Salo P, Vikstedt T et al. (2006) Bread fortified with cholecalciferol increase the serum 25-hydroxyvitamin D concentration in women as effectively as a cholecalciferol supplements. The Journal of Nutrition 136: 123-7.
NHMRC (National Health and Medical Research Council) (2006) Nutrient reference values for Australia and New Zealand. Available at: https://www.nhmrc.gov.au/filesnhmrc/publications/attachments/n35.pdf (accessed 11 April 2014).
NHS Choices (2013) Health claims about vitamin D examined. Available at:
- http://www.nhs.uk/news/2013/06June/Pages/health-claims-about-vitamin-D-examined.aspx#toxicity (accessed 27 May 2014).
NICE (National Institute for Health and Clinical Excellence) (2007) PH11 maternal and child nutrition: supporting evidence review 7. The effectiveness and cost-effectiveness of interventions to promote an optimal intake of Vitamin D to improve the nutrition of pre-conceptual, pregnant and post-partum women and children, in low income households. Available at: http://www.nice.org.uk/nicemedia/live/11943/43901/43901.pdf (accessed 11 April 2014).
NICE (National Institute for Health and Clinical Excellence) (2013) Vitamin D: implementation of existing guidance to pre-vent deficiency. Available at: http://www.nice.org.uk/nicemedia/live/13795/ 63153/63153.pdf (accessed 11 April 2014).
NIH (National Institutes of Health) (2011) Vitamin D Fact Sheet for Health Professionals. Available at: http://ods.od.nih.gov/factsheets/VitaminD-HealthProfessional/#en1 (accessed 27 May 2014).
Nordic Council of Ministers (2014) Nordic Nutrition Recommendations 2012. Integrating Nutrition and Physical Activity, 5th edn. Norden: Copenhagen, Denmark. Available at: http:// www.norden.org/en/theme/nordic-nutrition-recommendation/nordic-nutrition-recommendations-2012 (accessed 11 April 2014).
Novakovic R, Cavelaars A, Geelen A et al. (2014) Socio-economic determinants of micronutrient intake and status in Europe: a systematic review. Public Health Nutrition 17: 1031-45.
NOS (National Osteoporosis Society) (2013) Vitamin D and bone health: a practical clinical guideline for patient management. Available at: http://www.nos.org.uk/document.doc?id=1352 (accessed 11 April 2014).
O’Connor A & Benelam B (2011) An update on UK Vitamin D intakes and status, and issues for food fortification and supplementation. Nutrition Bulletin 36: 390-6.
O’Mahony L, Stepien M, Gibney MJ et al. (2011) The potential role of vitamin D enhanced foods in improving vitamin D status. Nutrients 3: 1023-41.
Ozkan B, Doneray H, Karacan M et al. (2009) Prevalence of vitamin D deficiency rickets in the eastern part of Turkey. European Journal of Pediatrics 168: 95-100.
Partti K, Heliovaara M, Impivaara O et al. (2010) Skeletal status in psychotic disorders: a population-based study. Psychosomatic Medicine 72: 933M0.
Piirainen T, Laitinen K & Isolauri E (2007) Impact of national fortification of fluid milks and margarines with vitamin D on dietary intake and serum 25-hydroxyvitamin D concentration in 4-year- old children. European Journal of Clinical Nutrition 61: 123-8.
Pilz S, Dobnig H, Nijpels G et al. (2009) Vitamin D and mortality in older men and women. Clinical Endocrinology (Oxford) 71: 666-72.
Pludowski P, Karczmarewicz E, Bayer M et al. (2013) Practical guidelines for the supplementation of vitamin D and the treatment of deficits in Central Europe - recommended vitamin D intakes in the general population and groups at risk of vitamin D deficiency. Endokrynologia Polska 64: 319-27.
Pludowski P, Grant WB, Bhattoa HP et al. (2014) Vitamin D status in Central Europe. International Journal of Endocrinology 2014: 589587.
Rejnmark L, Vestergaard P, Heickendorff L et al. (2008) Plasma 1,25(OH)2D levels decrease in postmenopausal women with hypovitaminosis D. European Journal of Endocrinology 158: 571-6.
Rejnmark L, Vestergaard P, Heickendorff L et al. (2011) Determinants of plasma PTH and their implication for defining a reference interval. Clinical Endocrinology (Oxford) 74: 37-43.
Richart T, Thijs L, Nawrot T et al. (2011) The metabolicsyndrome and carotid intima-media thickness in relation to the parathyroid hormone to 25-OH-D(3) ratio in a general population. American Journal of Hypertension 24: 102-9.
Roman Vinas B, Ribas Barba L, Ngo J et al. (2011) Projected prevalence of inadequate nutrient intakes in Europe. Annals of Nutrition and Metabolism 59: 84-95.
Rudnicki M, Thode J, Jorgensen T et al. (1993) Effects of age, sex, season and diet on serum ionized calcium, parathyroid hormone and vitamin D in a random population. Journal of Internal Medicine 234:195-200.
SACN (Scientific Advisory Committee on Nutrition) (2007) Update on vitamin D. Position statement. London: The Stationary Office.
Samefors M, Ostgren CJ, Molstad SA et al. (2014) Vitamin D deficiency in elderly people in Swedish nursing homes is associated with increased mortality. European Journal of Endocrinology 170: 667-75.
SCF (Scientific Committee for Food) (1993) Vitamin D: in nutrient and energy intakes of the European community. Brussels, Luxembourg.
SCF (Scientific Committee for Food) (2006) Tolerable upper intake levels of vitamins and minerals. Brussels: European Commission.
Shaw NJ & Mughal MZ (2013) Vitamin D and child health part 1 (skeletal aspects). Archives of Disease in Childhood 98: 363-7.
Sichert-Hellert W, Wenz G & Kersting M (2006) Vitamin intakes from supplements and fortified food in German children and adolescents: results from the DONALD study. The Journal of Nutrition 136:1329-33.
Skeie G, Braaten T, Hjartaker A et al. (2009) Use of dietary supplements in the European Prospective Investigation into Cancer and Nutrition calibration study. European Journal of Clinical Nutrition 63 (S4): S226-38.
Snijder MB, van Dam RM, Visser M et al. (2005) Adiposity in relation to vitamin D status and parathyroid hormone levels: a population-based study in older men and women. The Journal of Clinical Endocrinology and Metabolism 90: 4119-23.
Tetens I, Biltoft-Jensen A, Spagner C et al. (2011) Intake of micronutrients among Danish adult users and non-users of dietary supplements. Food & Nutrition Research 55: 7153.
Thacher TD & Clarke BL (2011) Vitamin D insufficiency. Mayo Clinic Proceedings 86: 50-60.
The Ministry of Health of Turkey (2006) Dietary guidelines for Turkey. Ankara, Turkey: The Ministry of Health of Turkey.
The Vegan Society (2014) Team up for healthy bones. Available at: http://www.vegansociety.com/resources/nutrition-health/vitamins- minerals-and-more/team-healthy-bones (accessed 11 July 2014).
Thorisdottir B, Gunnarsdottir I, Steingrimsdottir L et al. (2014) Vitamin D intake and status in 12-month-old infants at 63-66°N. Nutrients 6: 1182-93.
Thuesen B, Husemoen L, Fenger M et al. (2012) Determinants of vitamin D status in a general population of Danish adults. Bone 50: 605-10.
Tripkovic L, Lambert H, Hart K et al. (2012) Comparison of vitamin D2 and vitamin D3 supplementation in raising serum 25-hydroxyvitamin D status: a systematic review and metaanalysis. The American Journal of Clinical Nutrition 95: 135764.
Tylavsky FA, Cheng S, Lyytikainen A et al. (2006) Strategies to improve vitamin D status in northern European children: exploring the merits of vitamin D fortification and supplementation. The Journal of Nutrition 136: 1130-4.
Uusitalo U, Kronberg-Kippila C, Aronsson CA et al. (2011) Food composition database harmonization for between-country comparisons of nutrient data in the TEDDY Study. Journal of Food Composition and Analysis 24: 494-505.
van den Boom A, Serra-Majem L, Ribas L et al. (2006) The contribution of ready-to-eat cereals to daily nutrient intake and breakfast quality in a Mediterranean setting. Journal of the American College of Nutrition 25: 135-43.
van der A D, Rompelberg C & Hendriksen M (2012) Rapportage vitamine D status volwassen deelnemers NL de Maat. Bilthoven RIVM.
van Dam RM, Snijder MB, Dekker JM et al. (2007) Potentially modifiable determinants of vitamin D status in an older population in the Netherlands: the Hoorn Study. American Journal of Clinical Nutrition 85: 755-61.
van Summeren MJ, van Coeverden SC, Schurgers LJ et al. (2008) Vitamin K status is associated with childhood bone mineral content. The British Journal of Nutrition 100: 852-8.
Valtuena J, Gonzalez-Gross M, Huybrechts I et al. (2013) Factors associated with vitamin D deficiency in European adolescents: the HELENA study. Journal of Nutritional Science and Vitaminology 59: 161-71.
Van der Meer IM, Karamali NS, Boeke AJP et al. (2006) High prevalence of vitamin D deficiency in pregnant non-Western women in The Hague, Netherlands. The American Journal of Clinical Nutrition 84: 350-3.
Van der Meer IM, Boeke AJ, Lips P et al. (2008) Fatty fish and supplements are the greatest modifiable contributors to the serum 25-hydroxyvitamin D concentration in a multiethnic population. Clinical Endocrinology 68: 466-72.
Van der Meer IM, Middelkoop BJ, Boeke AJ et al. (2011) Prevalence of vitamin D deficiency among Turkish, Moroccan, Indian and sub-Sahara African populations in Europe and their countries of origin: an overview. Osteoporosis International 22: 1009-21.
Van der Wielen RPJ, Lowik MRH, Vandenberg H et al. (1995) Serum vitamin D concentrations among elderly people in Europe. Lancet 346: 207-10.
Van Schoor NM & Lips P (2011) Worldwide vitamin D status. Best Practice and Research. Clinical Endocrinology and Metabolism 25: 671-80.
Vandevijvere S, Amsalkhir S, Van Oyen H et al. (2012) High prevalence of vitamin D deficiency in pregnant women: a national cross-sectional survey. PLoS ONE 7: e43868.
Verkaik-Kloosterman J, Dodd KW, Dekkers AL et al. (2011) A three-part, mixed-effects model to estimate the habitual total vitamin D intake distribution from food and dietary supplements in Dutch young children. The Journal of Nutrition 141: 2055-63.
Vidailhet M, Mallet E, Bocquet A et al. (2012) Vitamin D: still a topical matter in children and adolescents. A position paper by the Committee on Nutrition of the French Society of Paediatrics. Archives of Pediatrics 19: 316-28.
Vieth R (2006) Critique of the considerations for establishing the tolerable upper intake level for vitamin D: critical need for revision upwards. The Journal of Nutrition 136: 1117-22.
Wahl DA, Cooper C, Ebeling PR et al. (2012) A global representation of vitamin D status in healthy populations. Archives of Osteoporosis 7: 155-72.
Wareham NJ, Byrne CD, Carr C et al. (1997) Glucose intolerance is associated with altered calcium homeostasis: a possible link between increased serum calcium concentration and cardiovascular disease mortality. Metabolism 46: 1171-7.
Weggemans RM, Schaafsma G & Kromhout D (2009) Towards an adequate intake of vitamin D An advisory report of the Health Council of the Netherlands. European Journal of Clinical Nutrition 63: 1455-7.
WHO (World Health Organization) Scientific Group on the Prevention and Management of Osteoporosis (2003) Prevention and management of osteoporosis: report of a WHO scientific group. World Health Organization: Geneva.
WHO/FAO (World Health Organization/Food and Agriculture Organization of the United Nations) (2004) Vitamin and mineral requirements in human nutrition. Report of a joint FAO/WHO
expert consultation, Bangkok, Thailand, 21-30 September 1998. WHO, Geneva, Switzerland.
WHO/IARC (World Health Organization/International Research Agency for Cancer) (2008) Vitamin D and cancer. A report of the IARC Working Group on Vitamin D. Available at: http:// www.iarc.fr/en/publications/pdfs-online/wrk/wrk5/Report_VitD.pdf (accessed 11 April 2014).
Wicherts IS, Boeke AJ, van der Meer IM et al. (2011) Sunlight exposure or vitamin D supplementation for vitamin D-deficient non-western immigrants: a randomized clinical trial. Osteoporosis International 22: 873-82.
Zofkova I & Hill M (2008) Biochemical markers of bone remodeling correlate negatively with circulating TSH in postmenopausal women. Endocrine Regulations 42: 121-7.
See also VitaminDWiki
Central Europe, like most of the world, has low vitamin D levels (under 30ng) – March 2014
Liverpool is starting universal supplementation and needs high dose vitamin D – March 2014
30 to 50 ng of vitamin D is optimal – Central Europe consensus Sept 2013 vs 10 ng in the study on this page
Vitamin D Webinar - cost of pre-term birth etc- Baggerly Nov 2013
Third study found that Infants needed 1600 IU of vitamin D – JAMA RCT May 2013
Unsupplemented infants were 19X more likely to be vitamin D deficient - May 2012
Vitamin D levels around the world - DSM review June 2014 which has the following