Little Vitamin D generated by face and hands
Size of the exposed body surface area, skin erythema and body mass index predict skin production of vitamin D
Journal of Photochemistry and Photobiology B: Biology 149 (2015) 224–229
Amra Osmancevic a, [Amra.Osmancevic@vgregion.se],11 Martin Gillstedt a, Kerstin Landin-Wilhelmsen b, Ann-Marie Wennberg Larko a, Olle Larkoa, Michael F. Holick c, Anne-Lene Krogstad a,d a Dept of Dermatology, Sahlgrenska University Hospital at Sahlgrertska Academy, University of Gothenburg, Sweden b Institution of Medicine, Sahlgrenska University Hospital at Sahlgrenska Academy, University of Gothenburg, Sweden c Boston University School of Medicine, Boston, MA 02118, United States d Dept of Dermatology, RH University Hospital, Norway
📄 Download the PDF from VitaminDWiki
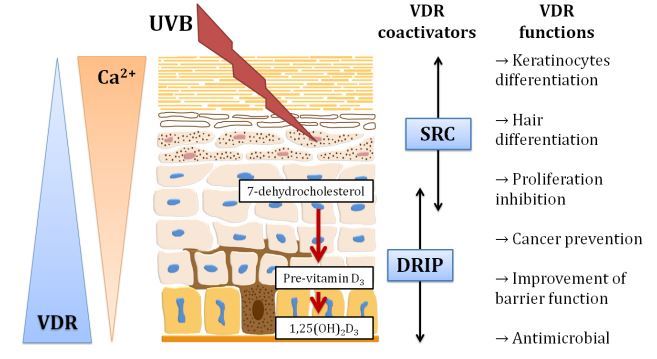
Background: Cholecalciferol (vitamin D3), produced in the skin by UVB irradiation (290-315 nm) of 7-dehydrocholesterol, is metabolized in the liver into 25-hydroxyvitamin D [25(OH)D] which is a major circulating metabolite.
Aim: To examine changes in serum concentrations of cholecalciferol and its metabolites after UVB exposure of different skin areas.
Methods: 21 healthy Caucasians ( skin type II and III , aged 23-47 years) were exposed to broadband UVB (290-320 nm) and randomized to either exposure to one minimal erythema dose given as a single dose, or a suberythemic dose given for 3 subsequent days. The following areas were exposed: face and back of hands, upper half of the body and the whole body, respectively. Serum cholecalciferol and 25(OH)D were measured immediately before start and 24 h after the 1st and last exposure, respectively.
Results: Subjects with whole body exposure had an average S-cholecalciferol increase per dose unit of
0.18 ng ml mJ 1 cm, 0.95 CI: (0.16, 0.20), upper body treatment
0.13 ng ml 1 mJ 1 cm2, 0.95 CI: (0.10, 0.15) and
face and hands exposure 0.013 ng ml 1 mJ 1 cm2, 0.95 CI: (-0.012, 0.037).
The increase in cholecalciferol correlated positively to the UVB dose and skin erythema and negatively to body mass index (BMI) when controlling for other factors.
Exposure of face and hands induces smaller cholecalciferol production in comparison with exposure of larger skin areas
Conclusion: Size of the exposed skin area, UVB dose, skin erythema and BMI were the major determinants for serum levels of skin synthesized cholecalciferol. Exposure of hands and face induces smaller cholecalciferol production in comparison with exposure of larger skin areas.
Introduction
Vitamin D3 (cholecalciferol), produced in the skin by solar UVB radiation (290-315 nm) of 7-dehydrocholesterol (7 DHC), is the main source of vitamin D in humans [1,2]. The potential for skin production of cholecalciferol depends on factors affecting UVB such as geographical latitude, season, time of the day, cloud cover and pollution [2,3]. Aging and increased skin pigmentation reduce the cutaneous production of cholecalciferol. During sun exposure 7-dehydrocholesterol is converted to previtamin D3. Once formed it begins to isomerize to vitamin D3 over a period of several hours. Continued exposure to sunlight converts previtamin D3 into lumis- terol and tachysterol. These photoproducts are in photoequilibrium with each other and as a result during prolonged sun exposure approximately 15-20% of the 7-dehydrocholesterol is converted to previtamin D3 [2,4-6]. Skin synthesized cholecalciferol enters the circulation and is bound to the vitamin D-binding protein (DBP) and reaches the maximal level in the circulation after about 24 h [5,7]. Cholecalciferol is then metabolized in the liver into 25-hydroxyvitamin D [25(OH)D or calcidiol], which is a major circulating metabolite with a half time of ~2 weeks [8]. S-25(OH)D is further hydroxylated in the kidneys into a biologically active hormone 1,25-dihydroxyvitamin D [1,25(OH)2D or calcitriol] with a half time ~4 h [8,9]. The concentration of circulating S-25(OH)D shows a seasonal variation due to the influence of the change in Zenith angle of the sun on the cutaneous production of vitamin D3 [3,10-12]. Globally, the average of S-25(OH)D concentrations is around 54 nmol/L, although large regions were identified with mean S-25(OH)D values below 50 nmol/L [13-15].
Vitamin D deficiency has been associated with increased risk for osteoporosis, infections, cancer, depressions, autoimmune- and cardiovascular diseases [1,2]. The major source of vitamin D for most children and adults is exposure to sunlight. Thus it is important to know how much skin needs to be exposed to sunlight to improve a person’s vitamin D status and whether any particular area of skin is more effective in producing vitamin D3.
This study evaluated concentration of S-25(OH)D and cholecal- ciferol, after exposure of different skin areas to different doses of UVB at the end of the winter when the levels of S-25(OH)D are lowest [10].
Material/methods
Participants
Healthy Caucasians, n = 21, (17 women and 4 men), skin phototype II (n = 5) and III (n = 16), aged 23-47 years (median age 28) were recruited from the hospital staff. Two subjects (nr 8 and 19) did not follow the blood tests flow and dropped out from the study. Skin phototype was determined according to Fitzpatrick scale [16]. The information about age, height, weight, sun behavior, food intake including vitamin supplements, traveling to sunny countries and use of medication or tan boxes during the last two months was obtained by a questionnaire.
Body mass index (BMI) was calculated as weight divided by the height in meter squared.
The participants were randomized to 2 groups: Group I (10 participants) were exposed to a single one minimal erythema dose (MED) and group II (9 participants) were given a suberythemic dose (according to their skin phototype and clinical routines to avoid sunburn and redness under treatment with broad band UVB) for 3 subsequent days 24 h apart. The following areas were exposed: face and back of hands (~5%), upper half of the body (~45%) and the whole body (~90%), respectively.
Intervention
The participants were exposed to broadband UVB (290320 nm) (Philips TL12/Corona 4 ESSHA Elagentur, Varnamo, Sweden) in a standing position with a 30 cm distance from the exposed area to the UVB source. The phototherapeutic device comprises of 28 Philips TL12 tubes a 100 W mounted on the walls of the box, produced by ESSHA electricity agency in Varnamo, Sweden. Minimal erythema dose was determined in all participants 24 h after UVB exposure of inner forearm prior to the study start [17]. Erythema was evaluated clinically, by the same investigator to minimise inter-observer disparity and improve intra-observer agreement [18]. The lowest dose of UVB that produces uniform erythema within distinct borders was used as an MED. Distinct redness within a well-demarcated border (all angles of the exposed rectangular, pen-marked area, 3 x 2 cm) on the inner forearm was assessed as erythema reaction. The median MED was 115.5 mJ/cm2 (min 49.5, max 165).
Ten subjects from group I were exposed once to 1 MED and 9 subjects (group II) were exposed 3 times, 24 h apart to a subery- themic dose of UVB.
Six subjects (3 from group I and 3 from group II) exposed only face (from the cheek to the hairline) and dorsal side of the hands; 7 subjects (4 from group I and 3 from group II) exposed the upper body (from the midway including face and hands) and 6 subjects (3 from group I and 3 from group II) exposed the whole body (naked, without clothes). All subjects used protecting sun glasses during the UVB exposures.
UVB dose was measured by PUVA Combi light from ESSHA Elagentur, Varnamo, Sweden.
A calibrated PUVA Combi light UV meter (model: DC0003, serial nr: 31000917) was used. The calibration of the sensor was performed using established test procedures and equipment with accuracy ±5% with respect to the European standard.
The median obtained total UVB dose for group I was 132 mJ/cm2 (min 82.5, max 165) and the median UVB dose (obtained from all 3 exposures) for group II was 148.5 mJ/cm2 (min 33, max 148.5). These doses are physical units and a weighting factor to calculate the physical broad band UVB dose as CIE weighted unit according to IEC 335-2-27 for broadband UVB (290-320 nm, peaks at 313 nm) is 0.074.
The study was performed during the winter (December to March) when S-25(OH)D are at their lowest levels in Gothenburg, Sweden, latitude 57° North [11,12].
Biochemical tests
Venous blood samples were drawn from an antecubital vein immediately before the 1st and 24 h after the first and last exposure, respectively. Serum samples were frozen stored at -80 °C until analysis.
Serum cholecalciferol (vitamin D3) was analyzed by high-performance liquid chromatography (HPLC) as previously described [19].
S-25(OH)D, and S-1,25(OH)2D were assessed by the 125I RIA (RadioImmunoAssay) at the Department of Clinical Chemistry, Sahlgrenska University Hospital, Gothenburg, Sweden. Coefficient of variation (CV) was 9.8% and 12.1% for intra-individual assays and 11.3% and 10.9% for inter-individual assays for S-25(OH)D and S-1,25(OH)2D, respectively.
S-PTH was analyzed with an immunochemical method (mass concentration) and a reference interval of 15-68. Photometry 600 nm was used to determine levels of S-calcium, reference value: 2.15-2.50 mmol/l. S-creatinine was analyzed with an enzymatic method, reference values: 45-90 pmol/l (women) and 60105 pmol/l (men).
Ethics
The study was approved by the Ethics committee at the University of Gothenburg and the Swedish National Data Inspection Board. The written consent form was obtained from all participants.
Statistical analysis
All data was analyzed with R version 3.0.3 (The R Foundation for Statistical Computing Vienna, Austria).
Multiple linear regression was used with increase in cholecalcif- erol (vitamin D3) as the dependent variable and dose per area unit, skin region (face and hands, upper body and full body respectively), skin erythema (yes/no) and BMI as explanatory variables. Different slopes were used for each combination of skin region and erythema dose, respectively. Also an additive intercept was used in the model with BMI added as an additive explanatory variable. In Fig. 1, a simpler model was used not including BMI and erythema. Different slopes with respect to dose were used for each skin region and a forced zero intercept was used.
All tests were two-tailed and P < 0.05 was considered statistically significant.
Figure 1 Increase of serum cholecalciferol (Vitamin D3) (ng/ml) in healthy subjects in relation to the obtained UVB dose (mJ/cm2) for each skin region.
Results
Serum cholecalciferol (vitamin D3) levels increased (P = 0.0002) in subjects who had UVB exposure on the whole body and the upper body to both regiments as an acute 1 MED dose or to the suberythemic dose fractionally given in 3 subsequent days. Those with full body exposure had an average increase per dose unit of 0.18 ng ml-1 mJ-1 cm2, 0.95 CI: (0.16, 0.20), those with upper body treatment a mean increase of 0.13 ng ml-1 mp1 cm2, 0.95 CI: (0.10, 0.15) while those with only face and hands exposure had no significant increase, 0.013 ng ml-1 mJ-1 cm2, 0.95 CI: (-0.012, 0.037) (Figs. 1 and 2).
The increase in cholecalciferol correlated positively with the total dose (per area) for those with upper body (P < 0.0001) and full exposure (P <0.0001), respectively (Fig. 1) but not in those with hands and face exposure (P = 0.33) (Fig. 1).
A multiple linear regression model was used to examine if the increase in cholecalciferol was due to the dose, exposed area, presence of erythema and/or BMI, respectively. The slopes of cholecal- ciferol increase versus dose (Fig. 1) for the whole body and the upper body were steeper compared to the slope for face and hands (P < 0.00001). The slope of increase in cholecalciferol versus dose for the whole body was significantly larger than that for upper body (P = 0.001).
The patients who received 1 MED as a single exposure had significantly larger cholecalciferol increase per dose than those with no erythema reported (P = 0.04) when controlling for the other factors (skin region and BMI).
BMI was then included as an additive explanatory variable. BMI correlated negatively with the residual increase of cholecalciferol (P = 0.02, -0.52 ng ml-1 kg-1 m2, 0.95 CI: (-0.91, -0.13)) in the model including dose, skin region and erythema (Fig. 3).
The cholecalciferol levels at start were between <1 ng/ml and 4 ng/ml except for one person with level of 7 ng/ml (median 2 ng/ml).
Fig. 2 . Changes in serum cholecalciferol (Vitamin D3) (ng/ml) versus time in healthy subjects divided into groups defined by skin erythema and exposed skin region.
Participants from group I, exposed to a personalized dose of MED, determined on their inner forearm, showed a difference in their erythema response. Seven of ten participants from group I, exposed to 1 MED, experienced distinct erythema 24 h after a single UVB exposure. Erythema occurred in 3 persons who exposed their face and hands, 2 individuals who exposed upper body and 2 subjects who exposed the whole body. Three participants exposed to 1 MED did not experience distinct erythema as others in the same group and therefore they were counted as non-erythema responders. As expected, none of those exposed to a suberythemic dose of UVB showed skin erythema.
Fig. 3. Residual increase in cholecalciferol (Vitamin D3) (ng/ml) in correlation to body mass index (BMI, kg/m2) controlling for UVB dose, skin region and skin erythema (P =0.02).
The median BMI was 22.0 kg/m2 (min 17.3, max 30.1).
The median concentration of S-25(OH)D at baseline was 25.5 ng/ml (min 14.1, max 48.3). The median concentration of S-25(OH)D 24 h after UVB exposure was 26.9 (min 13.9, max 48.9.), no significant increase from baseline (P = 0.41).
Levels in S-25(OH)D after exposure of different skin regions are presented in Fig. 4. The median baseline S-1,25(OH)2D concentration for all subjects was 48.1 pg/ml (min 32.2, max 85.) After 24 h the median S-1,25(OH)2D concentration was 44.2 pg/ml (min = 32.4, max = 79.4), no significant increase from baseline (P = 0.71).
S-PTH, S-calcium, S-ionized calcium and S-creatinine did not change significantly during UVB exposures.
One man had high S-calcium before and after one UVB exposure and was referred to the department of Endocrinology and familiar, hypercalcemic hypocalciuria was diagnosed.
Discussion
Increase in S-cholecalciferol (vitamin D3) after UVB exposure in healthy volunteers was independently due to the size of the exposed skin area, the dose of UVB radiance and BMI, respectively.
In a previous study the size of exposed area was the main determinant when the low UVB dose (0.75 standard erythema dose (SED)) was applied [20]. However, in the present study, the size of the exposed skin area was important irrespective of UVB exposure, i.e. single MED or suberythemic dose. UVB exposure of the whole body gave higher serum levels of S-cholecalciferol compared to the exposure of upper body or the face and hands (Figs. 1 and 2).
In previous studies the skin vitamin D equilibrium after UVB exposure seemed to be achieved [2,5,6,20]. The vitamin D response after UVB irradiation reached a plateau when more than 33% of body surface area was irradiated [21]. Around 35% of skin area was proposed to be exposed to avoid vitamin D deficiency (i.e. S-25(OH)D concentrations <10 ng/ml) according to a dose finding study of simulated summer sunlight [22].
Fig. 4 . Changes in serum 25(OH)D (ng/ml) versus time in healthy subjects divided into groups defined by skin erythema and exposed skin region.
In concordance with a previous study, UVB exposure of smaller body surface areas, such as face and hands induced less cholecalcif- erol production. Nevertheless, a significant increase of S-25(OH)D3 was noticed 3 days after the first UVB exposure [23].
It has been shown that the minimal UVB radiation dose of 18 mJ/cm2 was necessary to produce an increase in S-cholecalciferol [24]. However, smaller doses as 7.5 mJ/cm2 and 15 mJ/cm2 SED could increase serum 25-(OH)D [20]. In the present study there was a strong positive correlation between skin erythema, UVB dose, skin area and amount of synthesized cholecalcif- erol. Skin erythema as a measure of the obtained UVB dose might be a predictor of skin produced vitamin D while BMI was negative for vitamin D. Even if the purpose was to give an individualised dose of MED, in terms of erythema response to a single dose, to participants in group 1, some inter-personal differences were seen. Three subjects did not respond with distinct erythema after UVB exposure as expected. This observation might be due to physical characteristics other than MED and skin type. These differences indicate some difficulties in the MED measurement used in this study and response to the experimental UVB dose given according to this measurement. This is in line with results from previous studies that phototesting is based on subjective assessment of erythema and is not as precise and reproducible as expected [18]. It might be more beneficial to use ‘‘barely perceptible erythema reaction’’ than erythema with a well-defined border for measurement of the MED [18]. Regional differences in UV sensitivity of the skin must also be considered. Therefore, the skin area of the inner-forearm is not the optimal site to test MED on. This site may show wide inter-individual variation and the lower back or buttocks had probably been more reliable [25]. However, an obtained total UVB dose in terms of physical units was measured and calculated in the analysis.
The influence of the MED test on the results, especially in subjects who exposed the hands and face could not be comparable with subjects who exposed the upper-body and whole body, since hands and face are chronically exposed to ambient sun light.
Some differences between acute dose and more frequent low dose might be expected if we consider the utilisation of cholecalcif- erol over 3 days versus 1 day.
Cholecalciferol is a fat-soluble molecule and it is primarily deposited and sequestered in adipose tissue [26]. S-25(OH)D is lower in obese compared with leaner subjects [27,28]. Another reason for lower serum vitamin D in overweight subjects might be volumetric dilution of cholecalciferol in a fat pool [29]. This is further supported by the work of Wortsman et al., indicating that the skin of normal weighed and obese subjects does not differ in the amount of the 7 DHC or the functional capacity to produce chole- calciferol [28]. In the same study the increase in cholecalciferol synthesis 24 h after whole-body UVB irradiation (with a single suberythemic dose) was 57% lower in obese than in nonobese subjects. In another study, S-25(OH)D was positively related to skin thickness and negatively to BMI [30]. The greater seasonal variation of serum 25(OH)D in lean than in fat subjects was attributed to the larger fat mass and consequently, larger pool size in the latter group [30]. The negative correlation between increase in S-cholecalciferol and BMI found in our study (Fig. 3) is in accordance with these findings.
S-25(OH)D is commonly used to measure vitamin D status but in this study we have added analysis of S-cholecalciferol which better reflects cutaneous production of vitamin D. Peak S-cholecalciferol concentrations occur 24 h after acute UVB exposure [5,7]. Thus, blood samples were obtained before (basal determination) and 24 h after UVB irradiation. Changes in S-cholecalciferol concentrations over this period reflected the synthesis and transport of vitamin D3 from the skin into the blood stream. S-25(OH)D and S-1,25(OH)2D were fairly unaltered during this study. This indicates that the measurement of the vitamin D metabolites is insufficient to reflect effects of UVB on vitamin D status after such a short time interval (24-72 h). To measure the peak of S-25(OH)D after UVB exposure the period of 7 days would be preferable [5,7].
A limitation of this study was that S-25(OH)D was measured only 24 h after received UVB dose. Additional measurements up to 1 week after exposure might have given additional information about the effects over time on S-25(OH)D. Another limitation was the relatively small sample size. None of the participants was vitamin D deficient. The increase of S-25(OH)D after UVB exposure has been shown to correlate negatively with baseline calcidiol [20].
Nevertheless, the present results contribute to the evaluation of commonly used recommendations on the proposed skin area needed to be exposed to UVB in order to obtain an optimal vitamin D production. Furthermore, it seemed that skin synthesis of vitamin D might be differently regulated whether UVB doses caused skin erythema or not. Moreover, larger skin areas are needed to be exposed to UVB in order to obtain maximal vitamin D from UVB rather than to increase exposure time. The risk linked to excessive UV exposures, such as cutaneous carcinogenesis, could thereby be diminished. Repeated sun exposure of small skin areas can rise S-25(OH)D concentrations, although face and hands should not be overexposed to sunlight.
In conclusion, size of the exposed skin area, obtained UVB dose, skin erythema and BMI are the major determinants for serum levels of cholecalciferol produced after UVB exposures. Exposure of small body surface areas such as face and hands induces smaller cholecalciferol production compared with exposure of larger skin areas.
Conflict of interest All authors declare no conflict of interest.
Acknowledgments
The authors would like to thank all participants, medical students Anette Carle and Jesper Johansson for collecting and analyzing data, and to registered nurse Agneta Falted for her great help with study conduction.
Grants were received from the ALF agreement at the Sahlgrenska University Hospital and the Gothenburg medical association.
References
M.F. Holick, Sunlight and vitamin D for bone health and prevention of autoimmune diseases, cancers, and cardiovascular disease, Am.J. Clin. Nutr. 80 (2004) 1678s-1688s.
M. Wacker, M.F. Holick, Sunlight and Vitamin D: a global perspective for health, Dermatoendocrinol 5 (2013) 51-108.
M.F. Holick, Environmental factors that influence the cutaneous production of vitamin D, Am. J. Clin. Nutr. 61 (1995) 638s-645s.
W.G. Tsiaras, M.A. Weinstock, Factors influencing vitamin D status, Acta Derm. Venereol. 91 (2011) 115-124.
M.F. Holick, The cutaneous photosynthesis of previtamin D3: a unique photoendocrine system, J. Invest. Dermatol. 77 (1981) 51-58.
A.R. Webb, B.R. DeCosta, M.F. Holick, Sunlight regulates the cutaneous production of vitamin D3 by causing its photodegradation, J. Clin. Endocrinol. Metab. 68 (1989) 882-887.
J.S. Adams, T.L. Clemens, J.A. Parrish, M.F. Holick, Vitamin-D synthesis and metabolism after ultraviolet irradiation of normal and vitamin-D-deficient subjects, N. Engl. J. Med. 306 (1982) 722-725.
M.F. Holick, Vitamin D deficiency, N. Engl. J. Med. 357 (2007) 266-281.
M.F. Holick, Vitamin D status: measurement, interpretation, and clinical application, Ann. Epidemiol. 19 (2009) 73-78.
M.H. Kroll, C. Bi, C.C. Garber, H.W. Kaufman, D. Liu, A. Caston-Balderrama, K. Zhang, N. Clarke, M. Xie, R.E. Reitz, S.C. Suffin, M.F. Holick, Temporal relationship between vitamin D status and parathyroid hormone in the United States, PLoS ONE 10 (2015) e0118108.
K. Landin-Wilhelmsen, L. Wilhelmsen, J. Wilske, G. Lappas, T. Rosen, G. Lindstedt, P.A. Lundberg, B.A. Bengtsson, Sunlight increases serum 25(OH) vitamin D concentration whereas 1,25(OH)2D3 is unaffected. Results from a general population study in Goteborg, Sweden (The WHO MONICA Project), Eur. J. Clin. Nutr. 49 (1995) 400-407.
A. Hossein-nezhad, M.F. Holick, Vitamin D for health: a global perspective, Mayo Clin. Proc. 88 (2013) 720-755.
T. Hagenau, R. Vest, T.N. Gissel, C.S. Poulsen, M. Erlandsen, L. Mosekilde, P. Vestergaard, Global vitamin D levels in relation to age, gender, skin pigmentation and latitude: an ecologic meta-regression analysis, Osteoporos. Int. 20 (2009) 133-140.
J. Hilger, A. Friedel, R. Herr, T. Rausch, F. Roos, D.A. Wahl, D.D. Pierroz, P. Weber, K. Hoffmann, A systematic review of vitamin D status in populations worldwide, Br. J. Nutr. 111 (2014) 23-45.
D.A. Wahl, C. Cooper, P.R. Ebeling, M. Eggersdorfer, J. Hilger, K. Hoffmann, R. Josse, J.A. Kanis, A. Mithal, D.D. Pierroz, J. Stenmark, E. Stocklin, B. Dawson- Hughes, A global representation of vitamin D status in healthy populations, Arch. Osteoporos. 7 (2012) 155-172.
T.B. Fitzpatrick, The validity and practicality of sun-reactive skin types I through VI, Arch. Dermatol. 124 (1988) 869-871.
C.J. Heckman, R. Chandler, J.D. Kloss, A. Benson, D. Rooney, T. Munshi, S.D. Darlow, C. Perlis, S.L. Manne, D.W. Oslin, Minimal Erythema Dose (MED) testing, J. Vis. Exp. (2013) e50175.
J. Lock-Andersen, H.C. Wulf, Threshold level for measurement of UV sensitivity: reproducibility of phototest, Photodermatol. Photoimmunol. Photomed. 12 (1996) 154-161.
T.C. Chen, A.K. Turner, M.F. Holick, A method for the determination of the circulating concentration of vitamin D, J. Nutr. Biochem. 1 (1990) 272-276.
M.K. Bogh, A.V. Schmedes, P.A. Philipsen, E. Thieden, H.C. Wulf, Interdependence between body surface area and ultraviolet B dose in vitamin D production: a randomized controlled trial, Br. J. Dermatol. 164 (2011) 163-169.
- Results The increase in 25(OH)D after irradiation [Δ25(OH)D] was positively correlated with body surface area and UVB dose and negatively correlated with baseline 25(OH)D for the entire data sample.
- However, when analysing each body surface area separately, we found a significant UVB response correlation for 6% and 12%, but not for 24%. We also found a significant skin area response correlation for 0·75 SED but not for 1·5 and 3·0 SED when analysing each UVB dose separately. The relationships did not change significantly after adjustment of Δ25(OH)D for baseline 25(OH)D.
L.Y. Matsuoka, J. Wortsman, B.W. Hollis, Use of topical sunscreen for the evaluation of regional synthesis of vitamin D3, J. Am. Acad. Dermatol. 22 (1990) 772-775.
M.D. Farrar, A.R. Webb, R. Kift, M.T. Durkin, D. Allan, A. Herbert,J.L. Berry, L.E. Rhodes, Efficacy of a dose range of simulated sunlight exposures in raising vitamin D status in South Asian adults: implications for targeted guidance on sun exposure, Am. J. Clin. Nutr. 97 (2013) 1210-1216.
A. Osmancevic, K. Sandstrom, M. Gillstedt, K. Landin-Wilhelmsen, O. Larko, A.M. Wennberg Larko, F.M. Holick, A.L. Krogstad, Vitamin D production after UVB exposure - A comparison of exposed skin regions, J. Photochem. Photobiol. B 143c (2015) 38-43.
L.Y. Matsuoka, J. Wortsman, J.G. Haddad, B.W. Hollis, In vivo threshold for cutaneous synthesis of vitamin D3, J. Lab. Clin. Med. 114 (1989) 301-305.
M. Henriksen, R. Na, M.S. Agren, H.C. Wulf, Minimal erythema dose after multiple UV exposures depends on pre-exposure skin pigmentation, Photodermatol. photoimmunol. Photomed. 20 (2004) 163-169.
E.B. Mawer, J. Backhouse, C.A. Holman, G.A. Lumb, S.W. Stanbury, The distribution and storage of vitamin D and its metabolites in human tissues, Clin. Sci. 43 (1972) 413-431.
Y. Liel, E. Ulmer, J. Shary, B.W. Hollis, N.H. Bell, Low circulating vitamin D in obesity, Calcif. Tissue Int. 43 (1988) 199-201.
J. Wortsman, L.Y. Matsuoka, T.C. Chen, Z. Lu, M.F. Holick, Decreased bioavailability of vitamin D in obesity, Am. J. Clin. Nutr. 72 (2000) 690-693.
A.T. Drincic, L.A. Armas, E.E. Van Diest, R.P. Heaney, Volumetric dilution, rather than sequestration best explains the low vitamin D status of obesity, Obesity 20 (2012) 1444-1448 (Silver Spring).
A.G. Need, H.A. Morris, M. Horowitz, C. Nordin, Effects of skin thickness, age, body fat, and sunlight on serum 25-hydroxyvitamin D, Am. J. Clin. Nutr. 58 (1993) 882-885.