Relationships between 19 sterols and vitamin D3 in 3000 patients
Genetic, anatomic, and clinical determinants of human serum sterol and vitamin D levels.
Proc Natl Acad Sci U S A. 2014 Sep 8. pii: 201413561. [Epub ahead of print]
Stiles AR1, Kozlitina J2, Thompson BM1, McDonald JG1, King KS3, Russell DW4.
1 Departments of Molecular Genetics.
2 Internal Medicine, and.
3 Radiology, University of Texas Southwestern Medical Center, Dallas, TX 75390.
4 Departments of Molecular Genetics, David.Russell@UTSouthwestern.edu.
An unknown fraction of the genome participates in the metabolism of sterols and vitamin D, two classes of lipids with diverse physiological and pathophysiological roles. Here, we used mass spectrometry to measure the abundance of >60 sterol and vitamin D derivatives in 3,230 serum samples from a well-phenotyped patient population.
Twenty-nine of these lipids were detected in a majority of samples at levels that varied over thousands of fold in different individuals . Pairwise correlations between sterol and vitamin D levels revealed evidence for shared metabolic pathways, additional substrates for known enzymes, and transcriptional regulatory networks. Serum levels of multiple sterols and vitamin D metabolites varied significantly by sex, ethnicity, and age.
A genome-wide association study identified 16 loci that were associated with levels of 19 sterols and 25-hydroxylated derivatives of vitamin D (P < 10-7).
Resequencing, expression analysis, and biochemical experiments focused on one such locus (CYP39A1), revealed multiple loss-of-function alleles with additive effects on serum levels of the oxysterol, 24S-hydroxycholesterol, a substrate of the encoded enzyme.
Body mass index, serum lipid levels, and hematocrit were strong phenotypic correlates of interindividual variation in multiple sterols and vitamin D metabolites. We conclude that correlating population-based analytical measurements with genotype and phenotype provides productive insight into human intermediary metabolism.
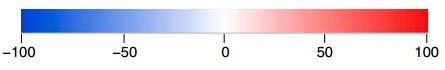
Fig. 6. Pairwise correlations between serum levels of analytes and clinical phenotypes.
Values are partial correlation coefficients×100 after adjustment for age, sex, and ethnicity between the indicated pairs of analytes and clinical parameters;
rvalues for individual comparisons are depicted using a bipolar color progression as indicated by the scale below the figure.
Only traits for which at least one rvalue was greater than or equal to ±10 are shown
PMID: 25201972