1-in-1,000,000 chance of dying (micromort)
1 micromort (μMt) = a 1-in-1,000,000 chance of dying
| # | Activity / exposure | Micromorts | Same risk as driving (@250 mi) |
|---|---|---|---|
| Baseline living | |||
| 1 | One day alive, average American (all causes) | 22 /day | 5,500 mi |
| 2 | One day alive, England & Wales | 24 /day | 6,000 mi |
| 3 | One day alive, Canada | 20 /day | 5,000 mi |
| 4 | One day alive at age 20 | ~1 /day | 250 mi |
| 5 | One day alive at age 90 | ~400 /day | 100,000 mi |
| 6 | Accidental (non-natural) death, US, per day | 1.6 | 400 mi |
| 7 | Accidental death excl. suicide, E&W, per day | 0.6 | 150 mi |
| 8 | First day of life (newborn, E&W) | 430 | 107,500 mi |
| 9 | Being murdered, US, per year | 48 /yr | 12,000 mi |
| 10 | Being murdered, Canada, per year | 15 /yr | 3,750 mi |
| 11 | Being murdered, England & Wales, per year | 10 /yr | 2,500 mi |
| Transport (distance for 1 μMt) | |||
| 12 | Motorcycle, 6 miles | 1 | 250 mi |
| 13 | Walking, 17 miles | 1 | 250 mi |
| 14 | Bicycle, 20 miles (10 mi in Howard's original) | 1 | 250 mi |
| 15 | Car, 250 miles (UK); 100 miles (US figure Greger uses) | 1 | — |
| 16 | Commercial jet, 1,000 miles | 1 | 250 mi |
| 17 | Train, 6,000 miles | 1 | 250 mi |
| 18 | Jet, 6,000 miles — cancer from cosmic radiation, not crash | 1 | 250 mi |
| Sport & recreation | |||
| 19 | Skiing, one day (US) | 0.7 | 175 mi |
| 20 | Scuba dive, one dive (BSAC members) | 5 | 1,250 mi |
| 21 | Scuba dive, one dive (non-club UK divers) | 10 | 2,500 mi |
| 22 | Running a marathon | ~7 | 1,750 mi |
| 23 | Skydive, one jump (US & UK, all jumpers) | 8 | 2,000 mi |
| 24 | Hang glider flight | 8 | 2,000 mi |
| 25 | Paragliding, one launch (Turkey) | 74 | 18,500 mi |
| 26 | BASE jump, one jump (Kjerag, Norway) | 430 | 107,500 mi |
| 27 | Matterhorn ascent attempt | ~2,840 | 710,000 mi |
| 28 | Everest, per successful ascent (1922–2012) | ~37,900 | 9.5 million mi |
| Household hazards (Australian data, per year) | |||
| 29 | Taking a bath | 0.3 | 75 mi |
| 30 | Sitting on a chair (falling off it) | 1.3 | 325 mi |
| 31 | Slipping and falling | 13 | 3,250 mi |
| 32 | Shark attack (~1 in 8 million/yr) | 0.125 | ~30 mi |
| Medical | |||
| 33 | Dental X-ray | ~0.05 | 12 mi |
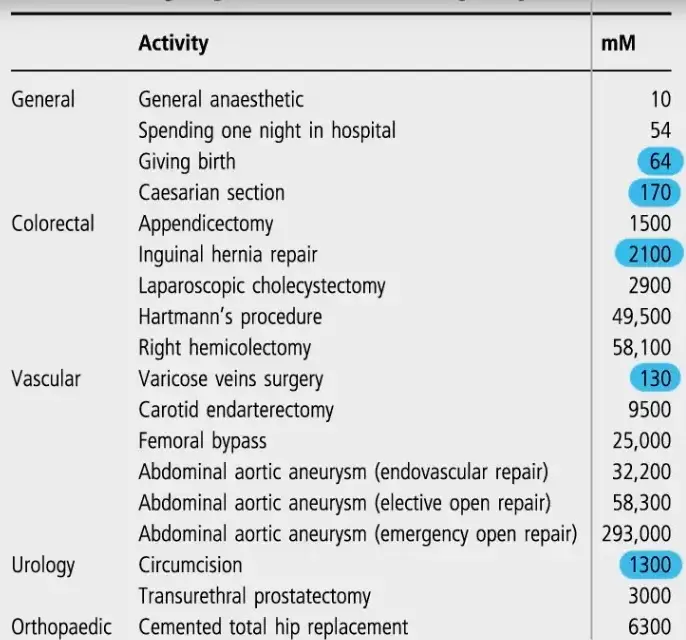
| 34 | General anesthesia (1 in 100,000) | 10 | 2,500 mi |
| 35 | One night in hospital | ~75 | 18,750 mi |
| 36 | Giving birth, vaginal | 120 | 30,000 mi (≈ once around Earth) |
| 37 | Giving birth, caesarean | 170 | 42,500 mi |
| 38 | Coronary artery bypass graft (1.2% mortality) | 12,000 | 3 million mi |
| 39 | Typical surgical operation (~0.5% mortality) | ~5,000 | 1.25 million mi |
| 40 | AstraZeneca COVID vaccine, one dose | 2.9 | 725 mi |
| Infection (Dec 2020 COVID IFR by age) | |||
| 41 | COVID infection at age 10 | 20 | 5,000 mi |
| 42 | COVID infection at age 25 | 100 | 25,000 mi |
| 43 | COVID infection at age 55 | 4,000 | 1 million mi |
| 44 | COVID infection at age 65 | 14,000 | 3.5 million mi |
| 45 | COVID infection at age 75 | 46,000 | 11.5 million mi |
| 46 | COVID infection at age 85 | 150,000 | 37.5 million mi |
| 47 | 1918 Spanish flu infection | ~30,000 | 7.5 million mi |
| Chronic exposures (Howard, 1979 — 1 μMt each) | |||
| 48 | Drinking 0.5 L wine (cirrhosis) | 1 | 250 mi |
| 49 | Smoking 1.4 cigarettes | 1 | 250 mi |
| 50 | 1 hour in a coal mine (black lung) | 1 | 250 mi |
| 51 | 3 hours in a coal mine (accident) | 1 | 250 mi |
| 52 | 2 days in NYC or Boston, 1979 (air pollution) | 1 | 250 mi |
| 53 | 2 months living with a smoker | 1 | 250 mi |
| 54 | 1 year drinking Miami tap water (chloroform) | 1 | 250 mi |
| 55 | 100 charcoal-broiled steaks (benzopyrene) | 1 | 250 mi |
| Drugs | |||
| 56 | One ecstasy tablet (alone) | 0.5 | 125 mi |
| 57 | One ecstasy tablet (with other drugs) | 13 | 3,250 mi |
Notes
- Selection effects. The marathon and skydiving figures describe people who chose and trained for those activities, not a random 80-year-old attempting them. Same for scuba: club members are 5, everyone else 10.
- Per-event vs per-year vs per-mile. Rows 1–11 and 29–32 are rates over time; rows 12–28 are per event or per distance. Mixing them silently is the most common error in these tables.
- Rows 48–55 are chronic risks and don't really belong on a micromort scale — Howard included them, but a lost-life-expectancy unit (the microlife, ~30 minutes) fits better. They're here because they're widely quoted, and the 1979 pollution and water numbers are badly dated.
- The 1979 vintage matters generally. Car, air, and rail fatality rates have all fallen substantially since Howard's original list.
Micromorts on the web
- Fry 2016, PMID 26747014
- Howard 1989, PMID 10295520
- Micromort compilation w/ primary refs
- Australian household figures
- Dr. Greger Aug 2026]